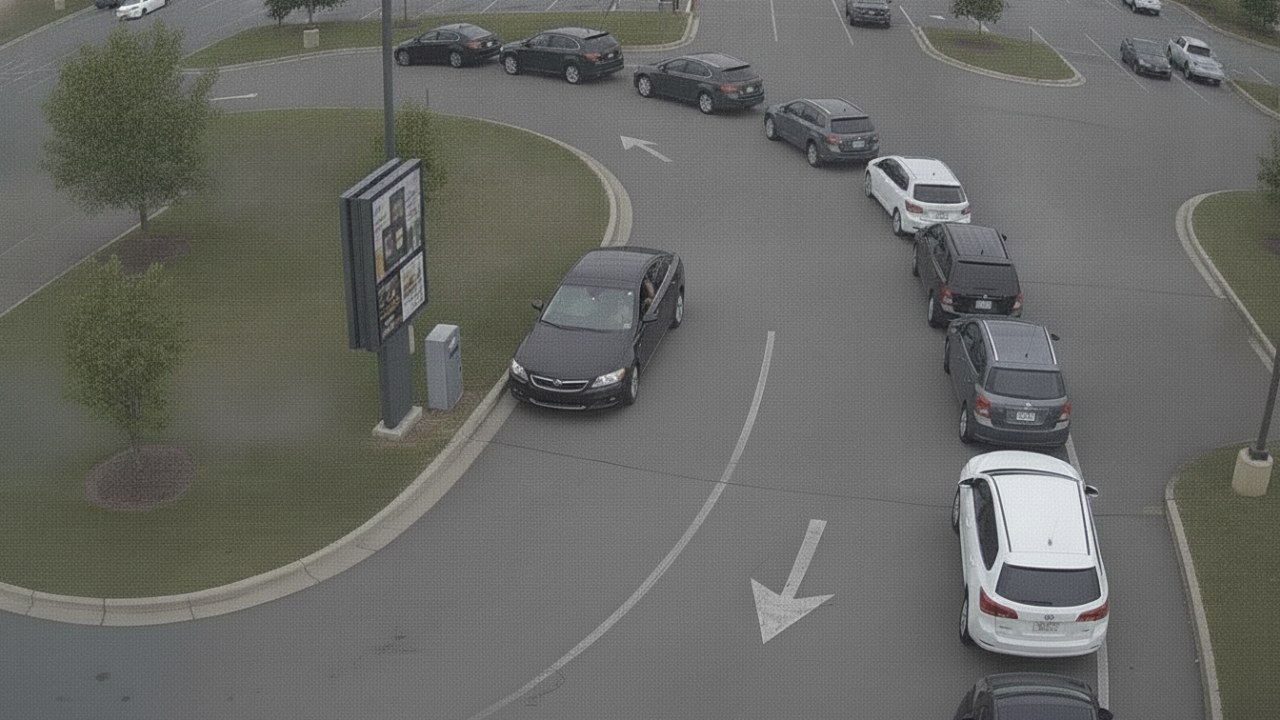
Four kinds of readings describe everything a camera sees.
A zone's measurements say what its readings mean, such as the number of people in a queue, the time each car spends at the window or how full a pan is. The same four kinds of readings cover every industry.
| Reading | What it records | Example |
|---|---|---|
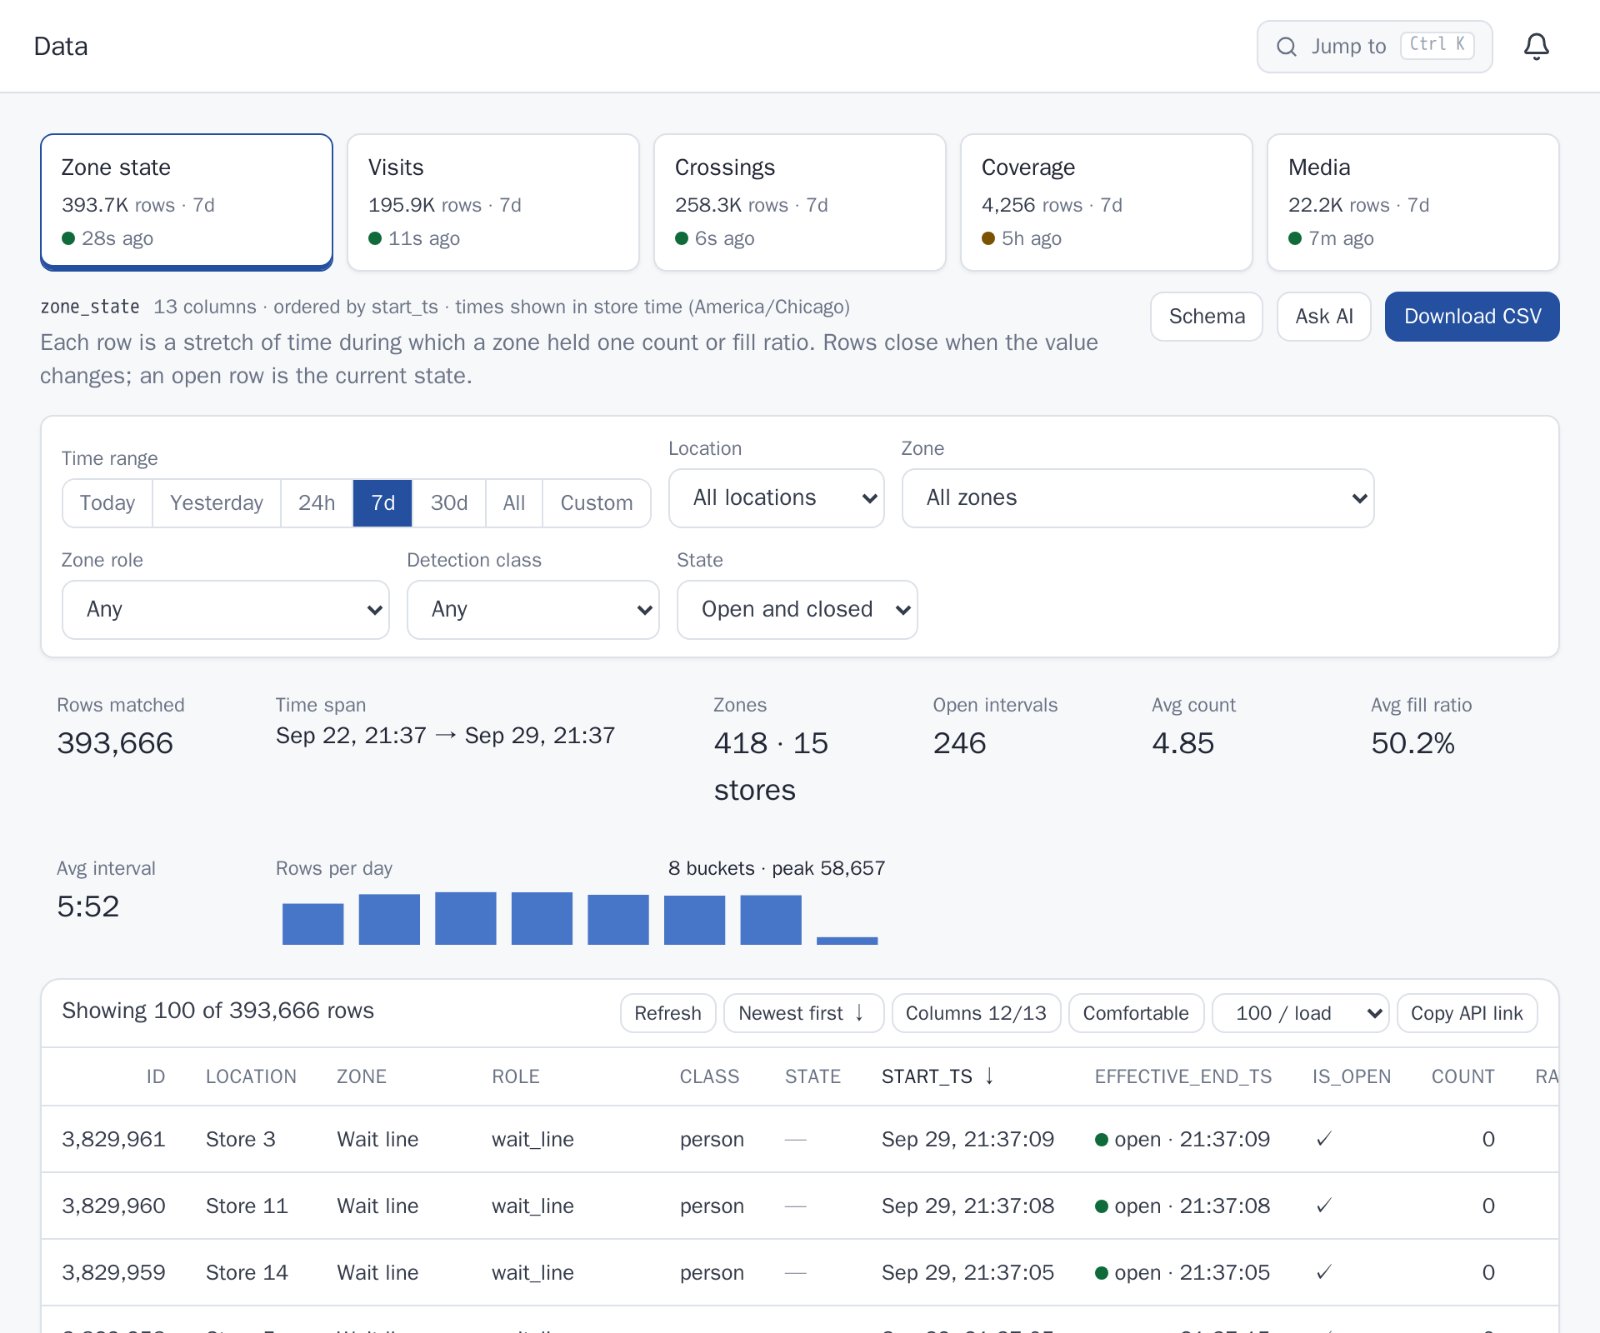
| Zone states | How a zone stands over time: a count, a fill level or a state, each held for as long as it lasts. | pan: mac & cheese · 3 of 12 · 11:52–12:04 |
| Visits | Something's time in a zone, from arrival to departure. | car at menu board · 0:48 |
| Crossings | A line crossed, in or out. | front door · in · 12:41:05 |
| Coverage | Each camera's health, so every figure knows when its data was partial. | cam-drive · healthy · 100% |
Every reading, queryable.
Filter by time, site, zone, detection class and direction; see the rows behind any dashboard; download CSV or copy the API link. Ask a question about what you're looking at without leaving the page.
- Live: the newest reading is seconds old
- Times shown in each site's own time zone
- The same rows every dashboard reads
A year of history answers in seconds.
Readings roll up into fifteen-minute and daily summaries per zone. Dashboards and questions read the summaries, so a year-over-year comparison across a hundred sites is as quick as today's view. A reading that arrives late recomputes only the range it touches.
# 15-minute summary, one zone
zone       store_7 · wait_line
bucket     12:30–12:45
observed   900 s   present 900 s
count·s    4,212   # average line 4.7
above par  540 s   # line over 4 for 9 min
coverage   100%
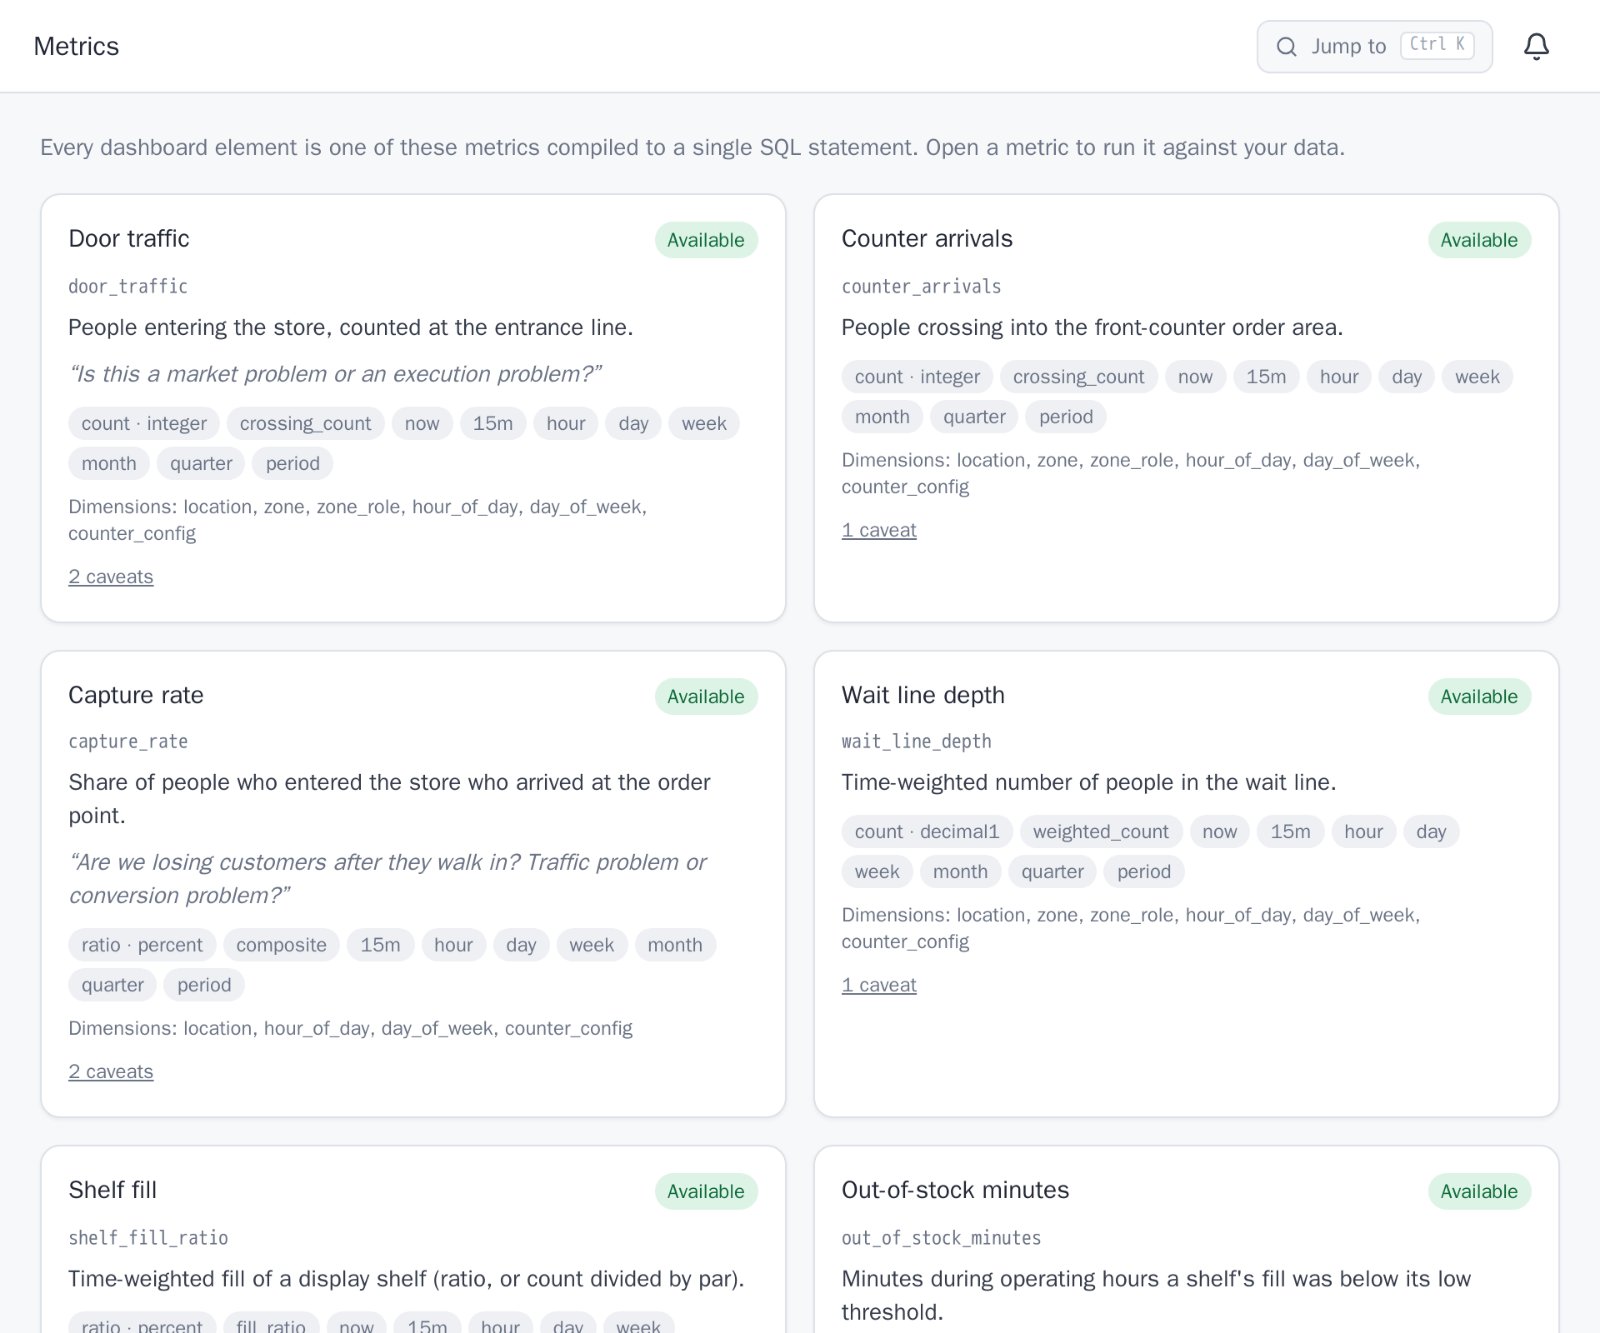
Every number has a definition.
79 metrics today, 38 for restaurants and the rest for warehouses: each with its definition, unit, the question it answers, the grains and breakdowns it supports, and its caveats. Dashboards, alerts and Ask all read the same definitions.
- Capture rate, line wait, walk-outs, drive-thru time
- Dock turn, detention, labor cost per unit, honeycombing
- Your business rates turn hours into dollars
Numbers a finance team can stand behind.
One schema, every site
A store, a warehouse and a job site write the same shapes, so they compare cleanly.
Coverage on every figure
When a camera was down or blocked, the figures it feeds say so, instead of reading low.
Your rates, your dollars
Labor rate, detention rate, rent per position: set once, and every dollar figure uses them.
Isolated per customer
Each organization's data is separated in the database and enforced on every query.
Access by role and site
A store manager sees their store; an area manager their district; executives everything.
Evidence on request
The still or clip behind a reading can be pulled from the device for as long as it's kept there.
Use the data where you already work.
| Starter | Professional | Enterprise | |
|---|---|---|---|
| Data explorer and CSV | ✓ | ✓ | ✓ |
| API | — | ✓ | ✓ |
| Dataset downloads | — | — | ✓ |
| MCP connectors for AI tools | — | — | ✓ |