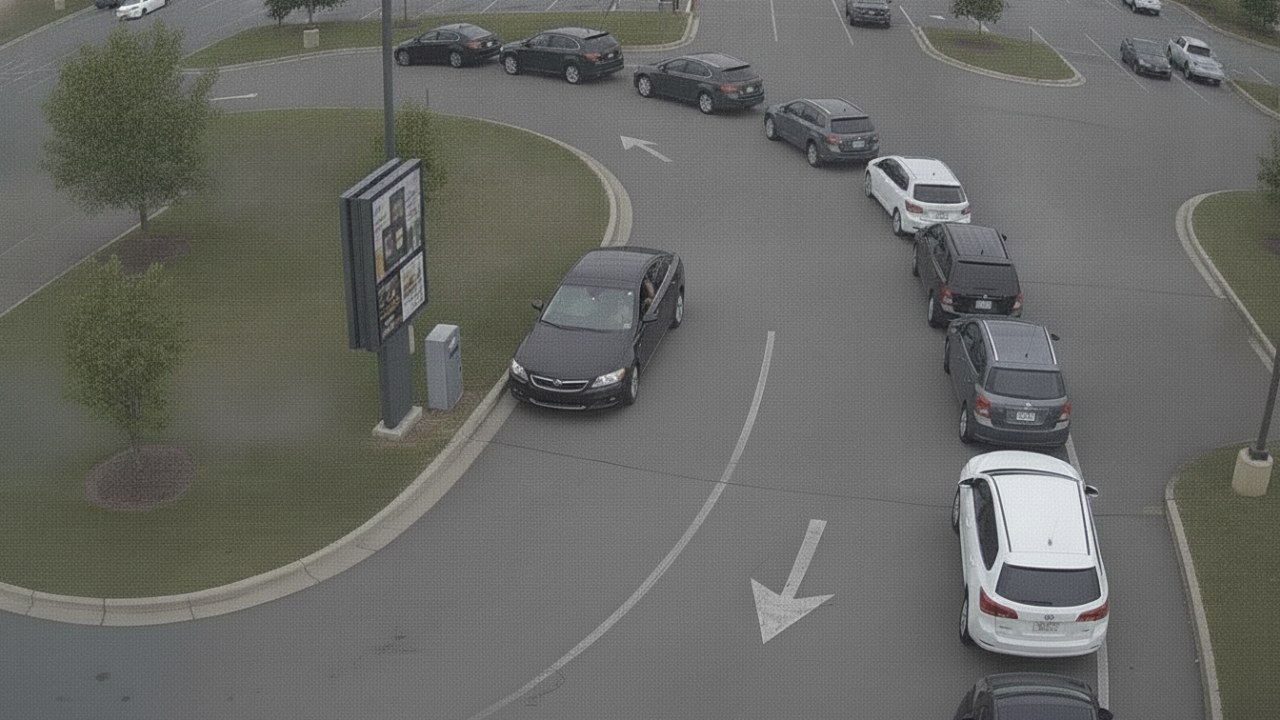
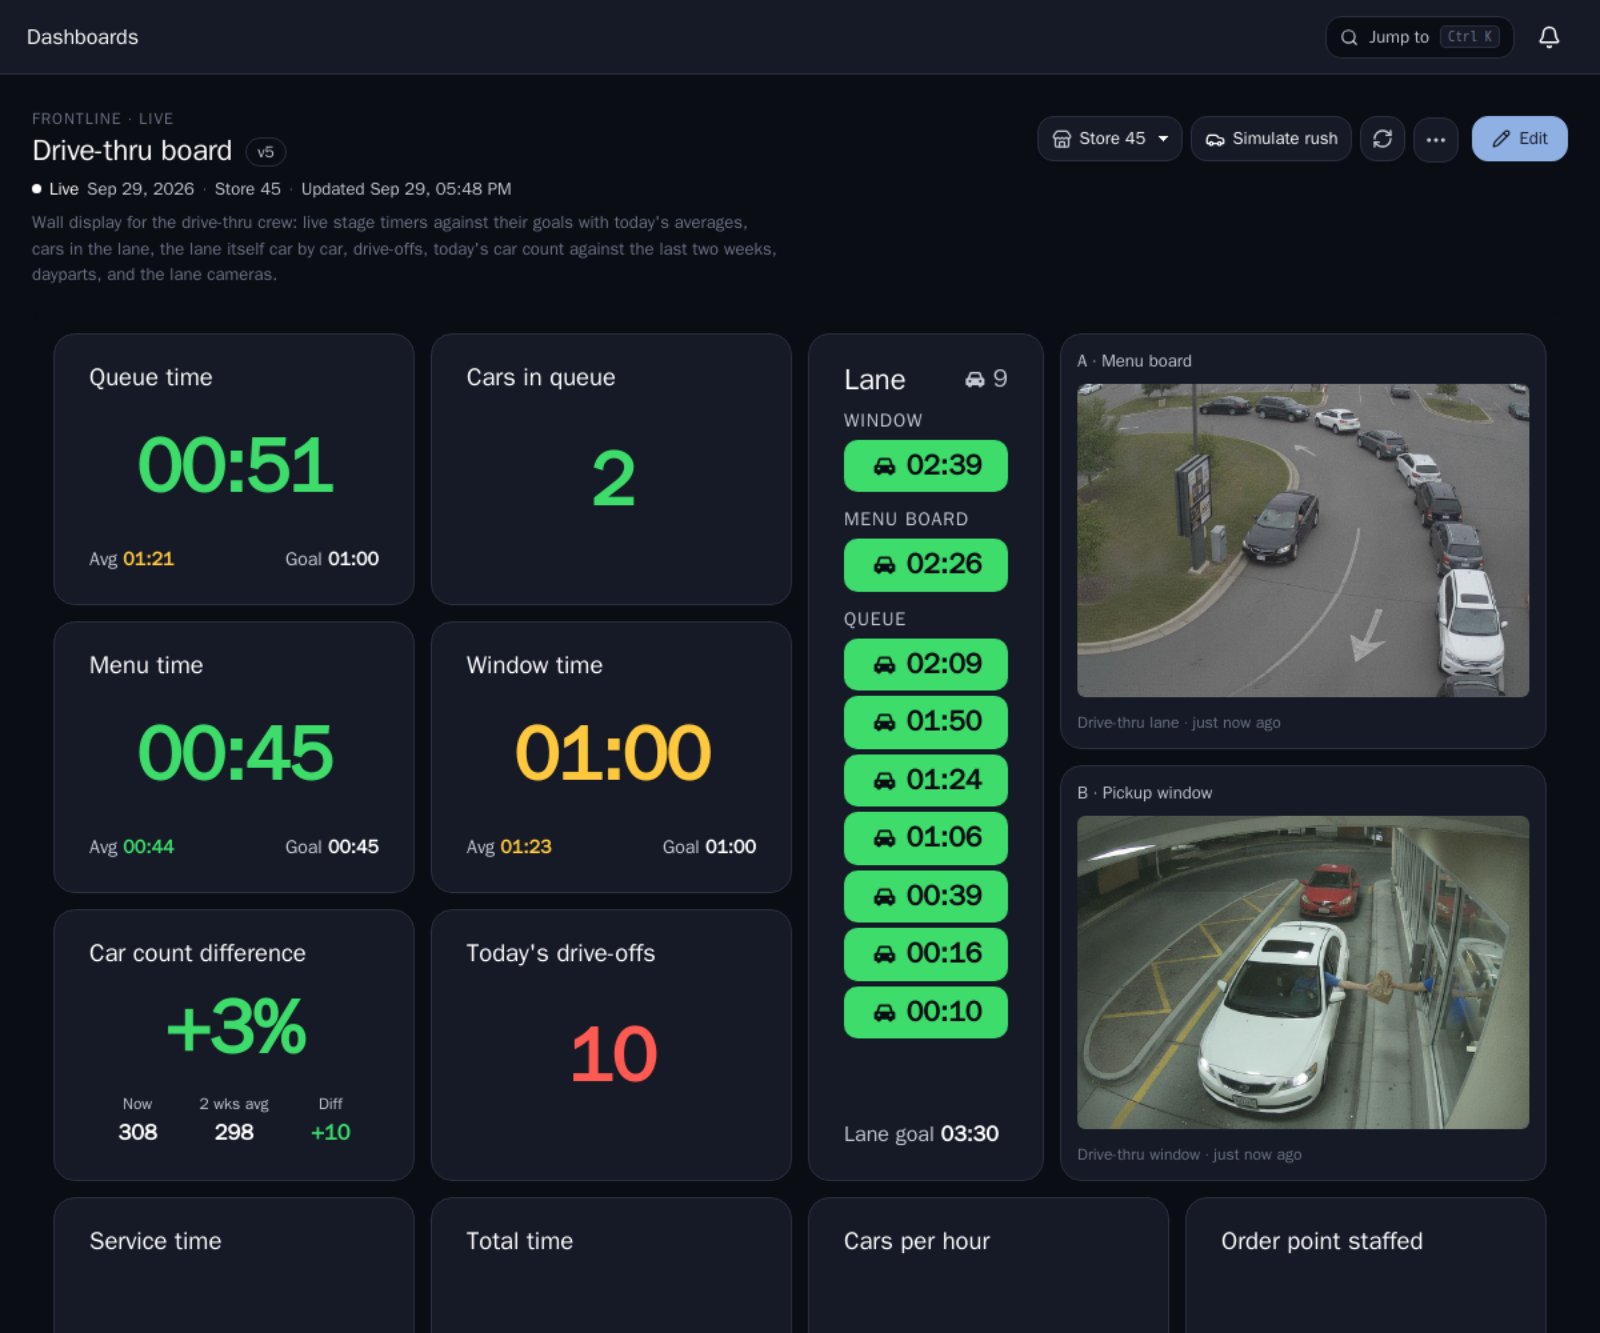
 Lane 9 cars · avg 3:42
Drive-thru lane
Cars at each stage, time at the menu board and window, cars that leave the lane
A POS records only the guests who paid. VideoBI also measures the car that left the lane, the guest who gave up on the line and the order lost to an empty pan, and turns every store's cameras into the revenue, labor and food cost numbers that the CFO, the area manager and the crew work from.
A P&L shows that Store 14 has been down for three quarters, but it can't separate fewer people coming in from more people leaving without ordering. The first is a market problem and the second is a management problem, and each calls for a different decision.
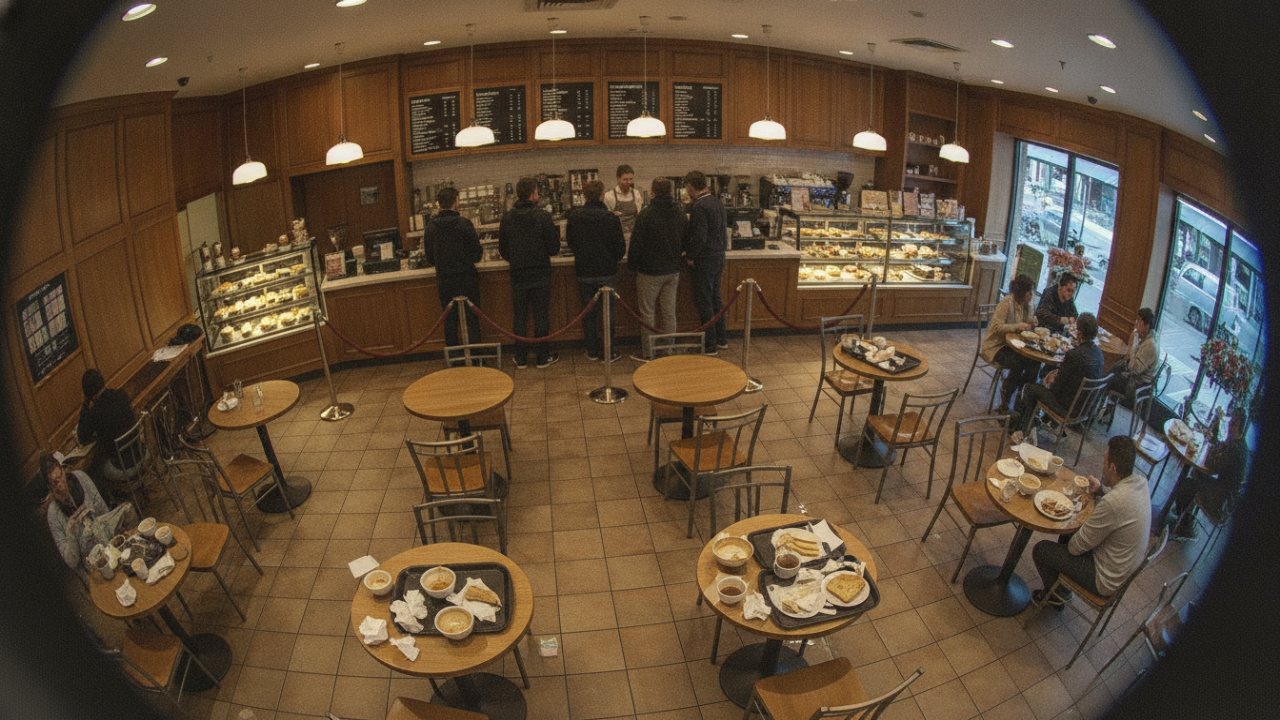
A guest who sees a long line and leaves never reaches the register, so no system records the lost sale.
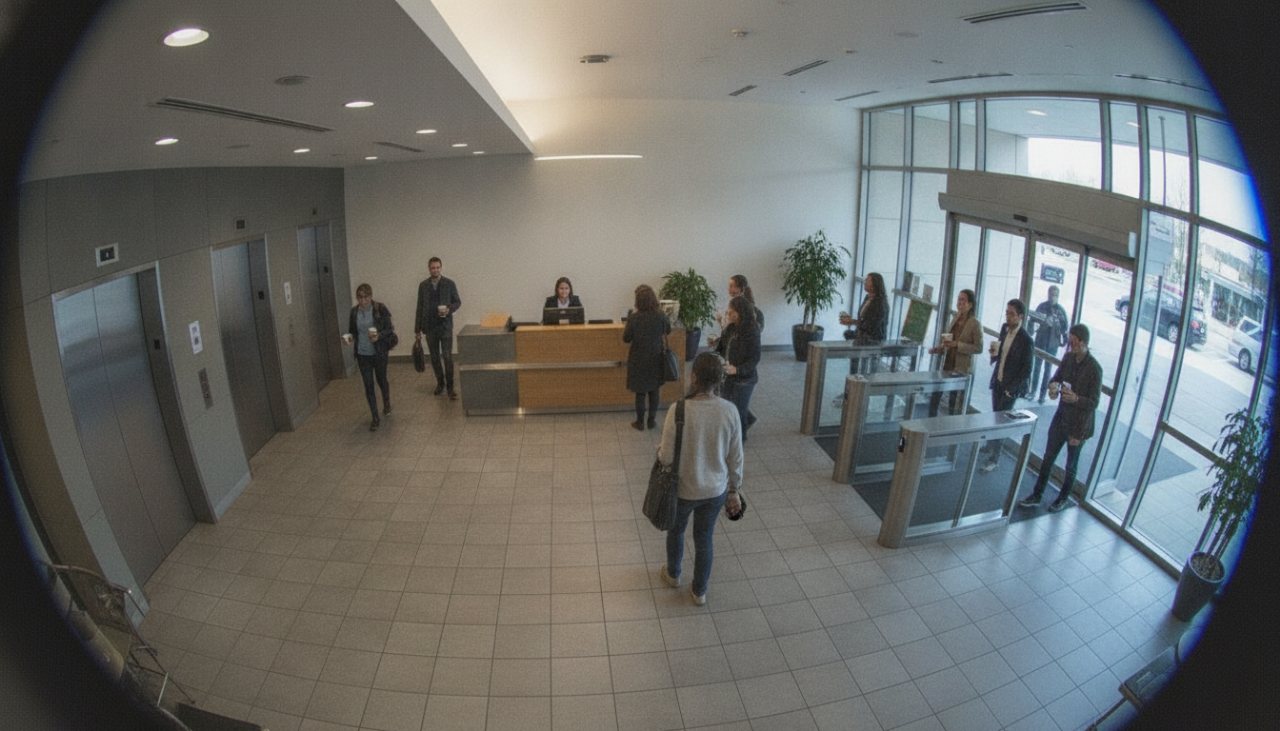
They show who was scheduled to work, and leave out the times a register sat empty with six guests in line.
Food thrown away at the end of its hold time and orders lost to an empty pan rarely appear in the same report.
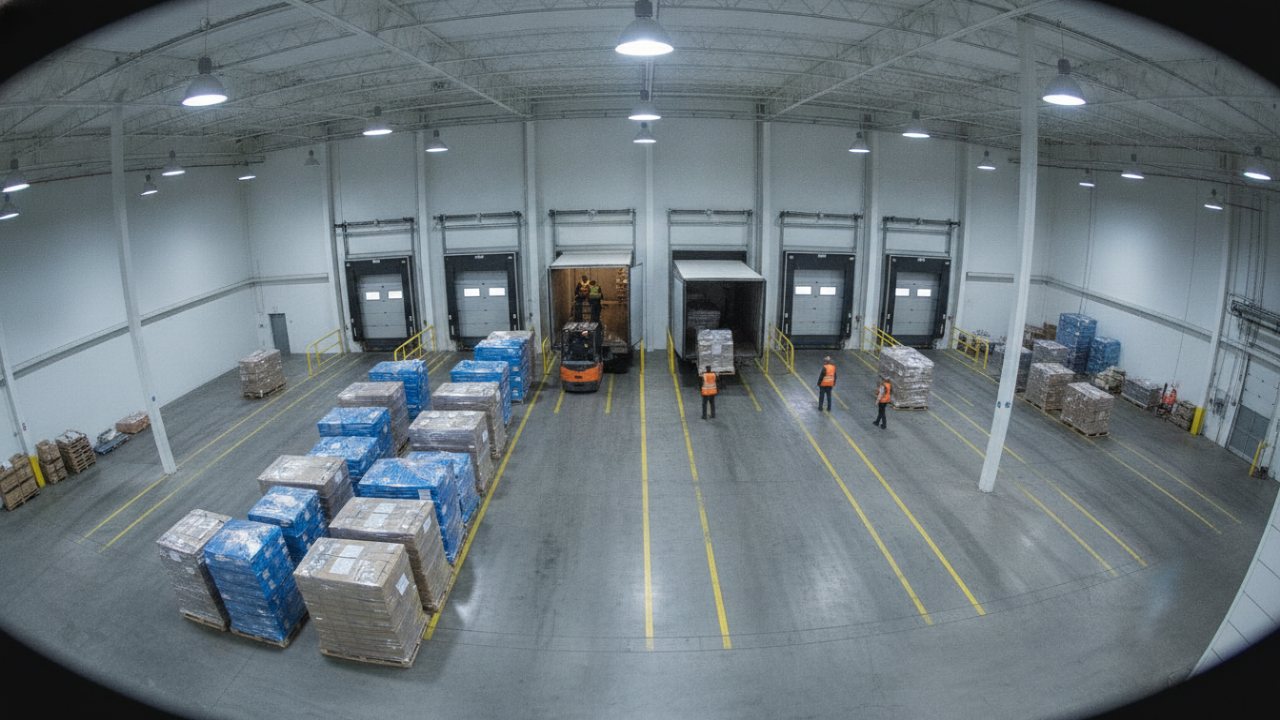
An edge device on site reads the cameras and writes readings for the zones that matter. The video stays in the building.
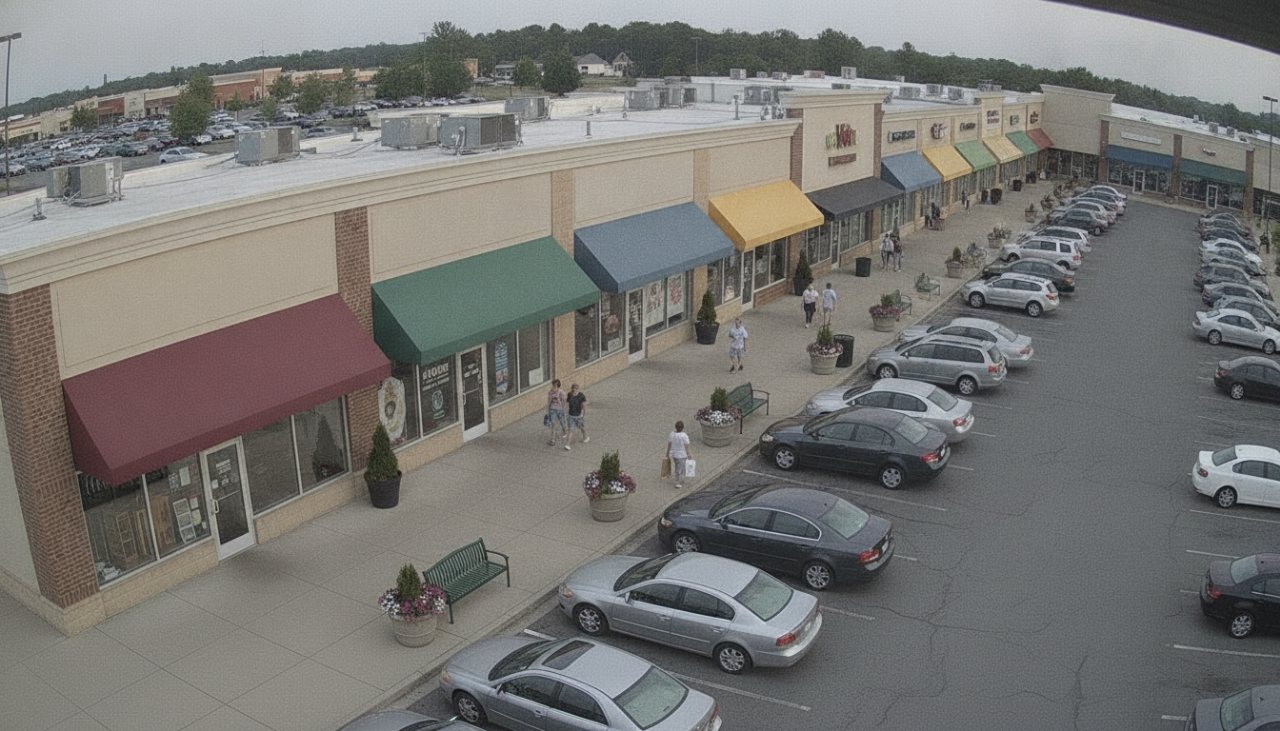
Lane 9 cars · avg 3:42Cars at each stage, time at the menu board and window, cars that leave the lane
Line 5 · waiting 2:48Guests in line and their wait, registers staffed, guests who leave without ordering
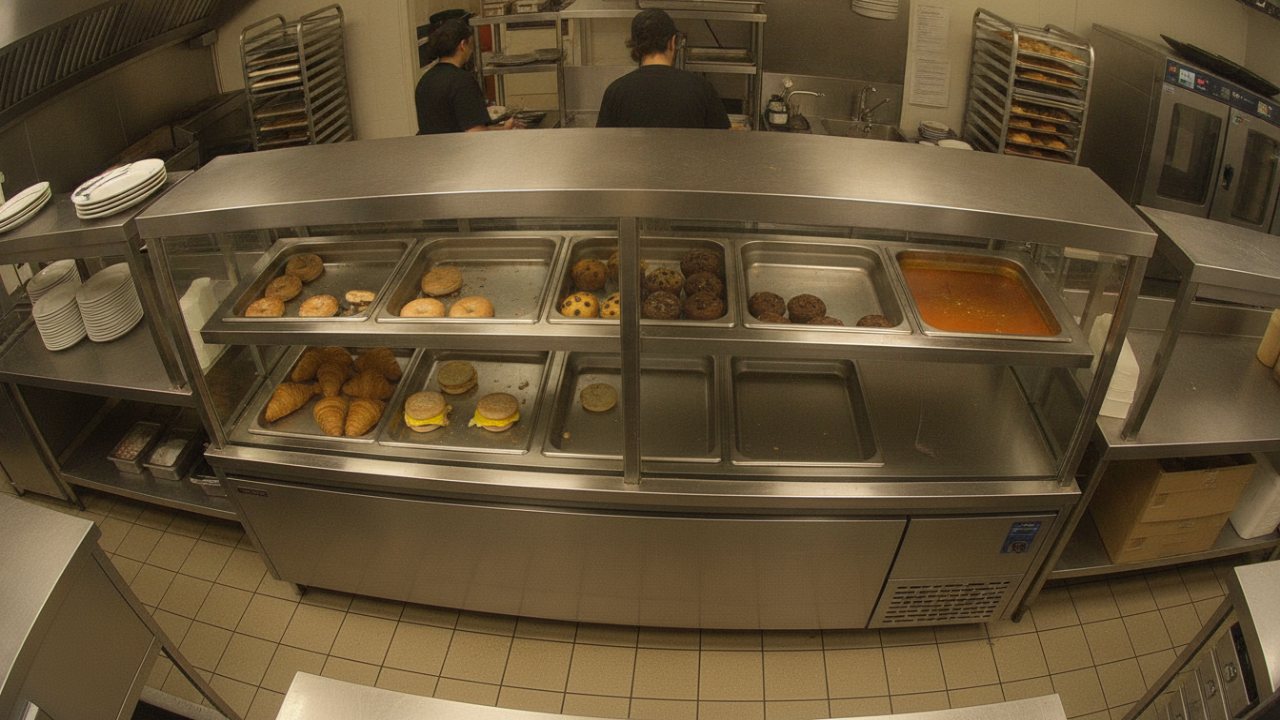 Mac & cheese · 3 of 12
How full each pan is, hold times, batches cooked and thrown away
Capture rate by store and hour shows where guests give up, and what serving them is worth.
Stage-by-stage drive-thru times find the bottleneck: the order point, the window, or the kitchen.
Pan levels and a bake plan built from each store's own hours keep the cabinet full at the peak.
Door traffic and capture rate before and during a promotion show whether it brought guests you could serve.
Registers staffed against guests waiting, hour by hour, shows where hours are short and where they sit idle.
Batches cooked, held and thrown away, per item and daypart, with the plan that would have avoided them.
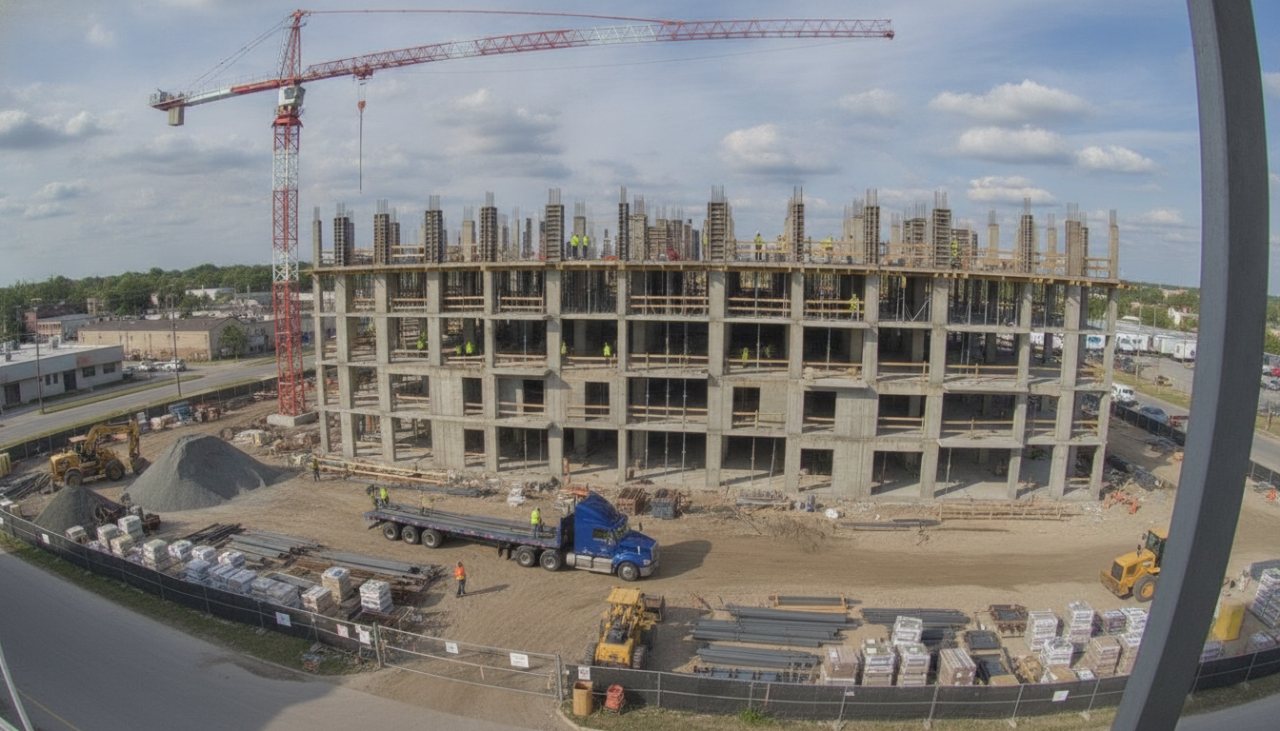
Doors opened late, stations empty during operating hours, activity after close.
Every store ranked by execution, normalized for traffic, so visits go where they pay.
Each role sees the same governed numbers, arranged for the decisions it makes.
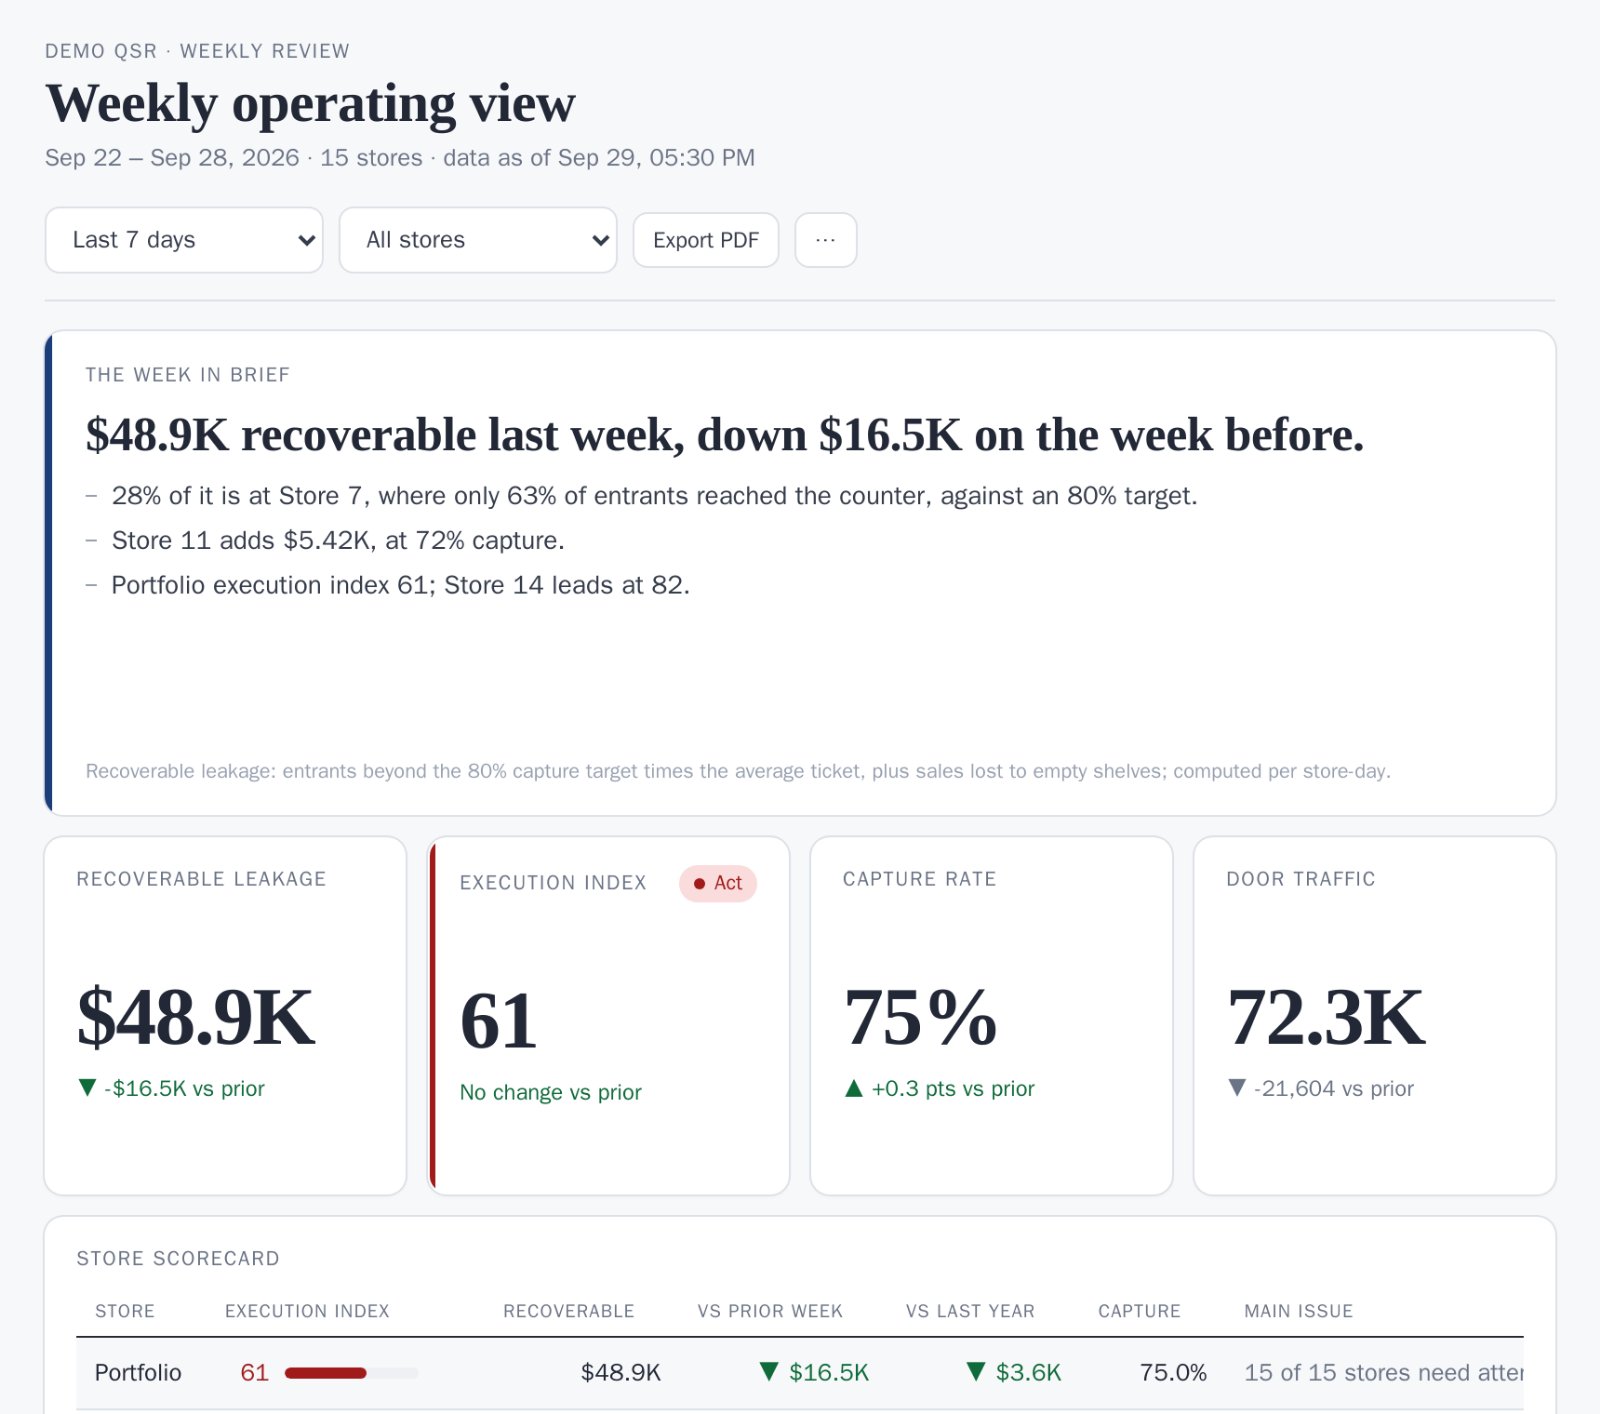
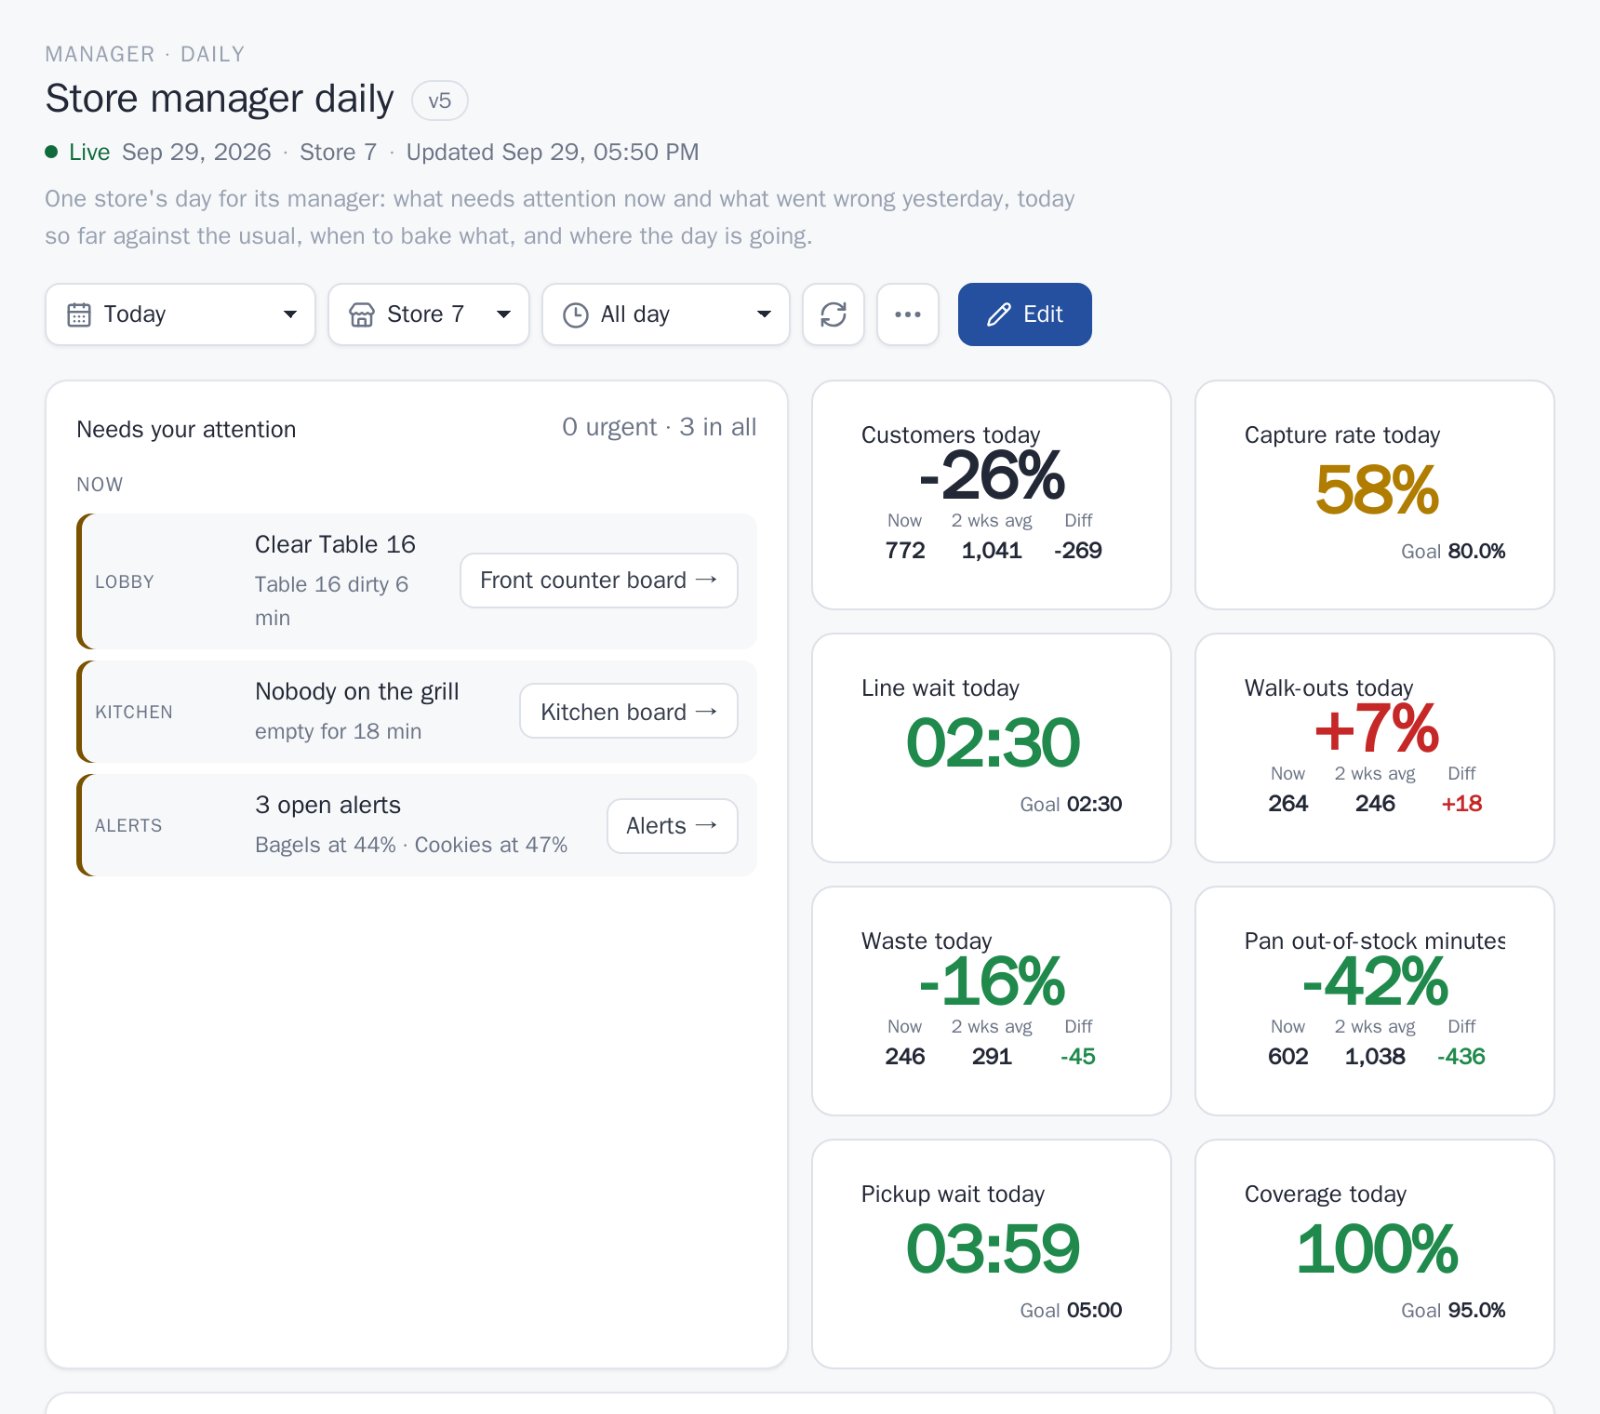
Ask VideoBI in plain language. It investigates across every site and answers with the numbers and the evidence behind them.
An execution shortfall: more guests came in, and fewer of them bought. Door traffic at Store 7 rose +2.5% this quarter, but its capture rate fell −6.9 pts to 66%, 8.8 pts below the chain's 75%. Store 14 captures 80%.
A real answer from Ask in the live demo's sample chain. How Ask works →
Recoverable dollars are counted week by week and pay for the system. Decisions about capital, leases and operating models made with the same evidence affect results for years.
Recoverable dollars use the chain's own rates: average ticket, labor rate and food cost, set once in VideoBI.
We'd like to use analytics cookies to see how people use this site, and LinkedIn's tag to measure our ads. Both stay off unless you accept. Cookie notice