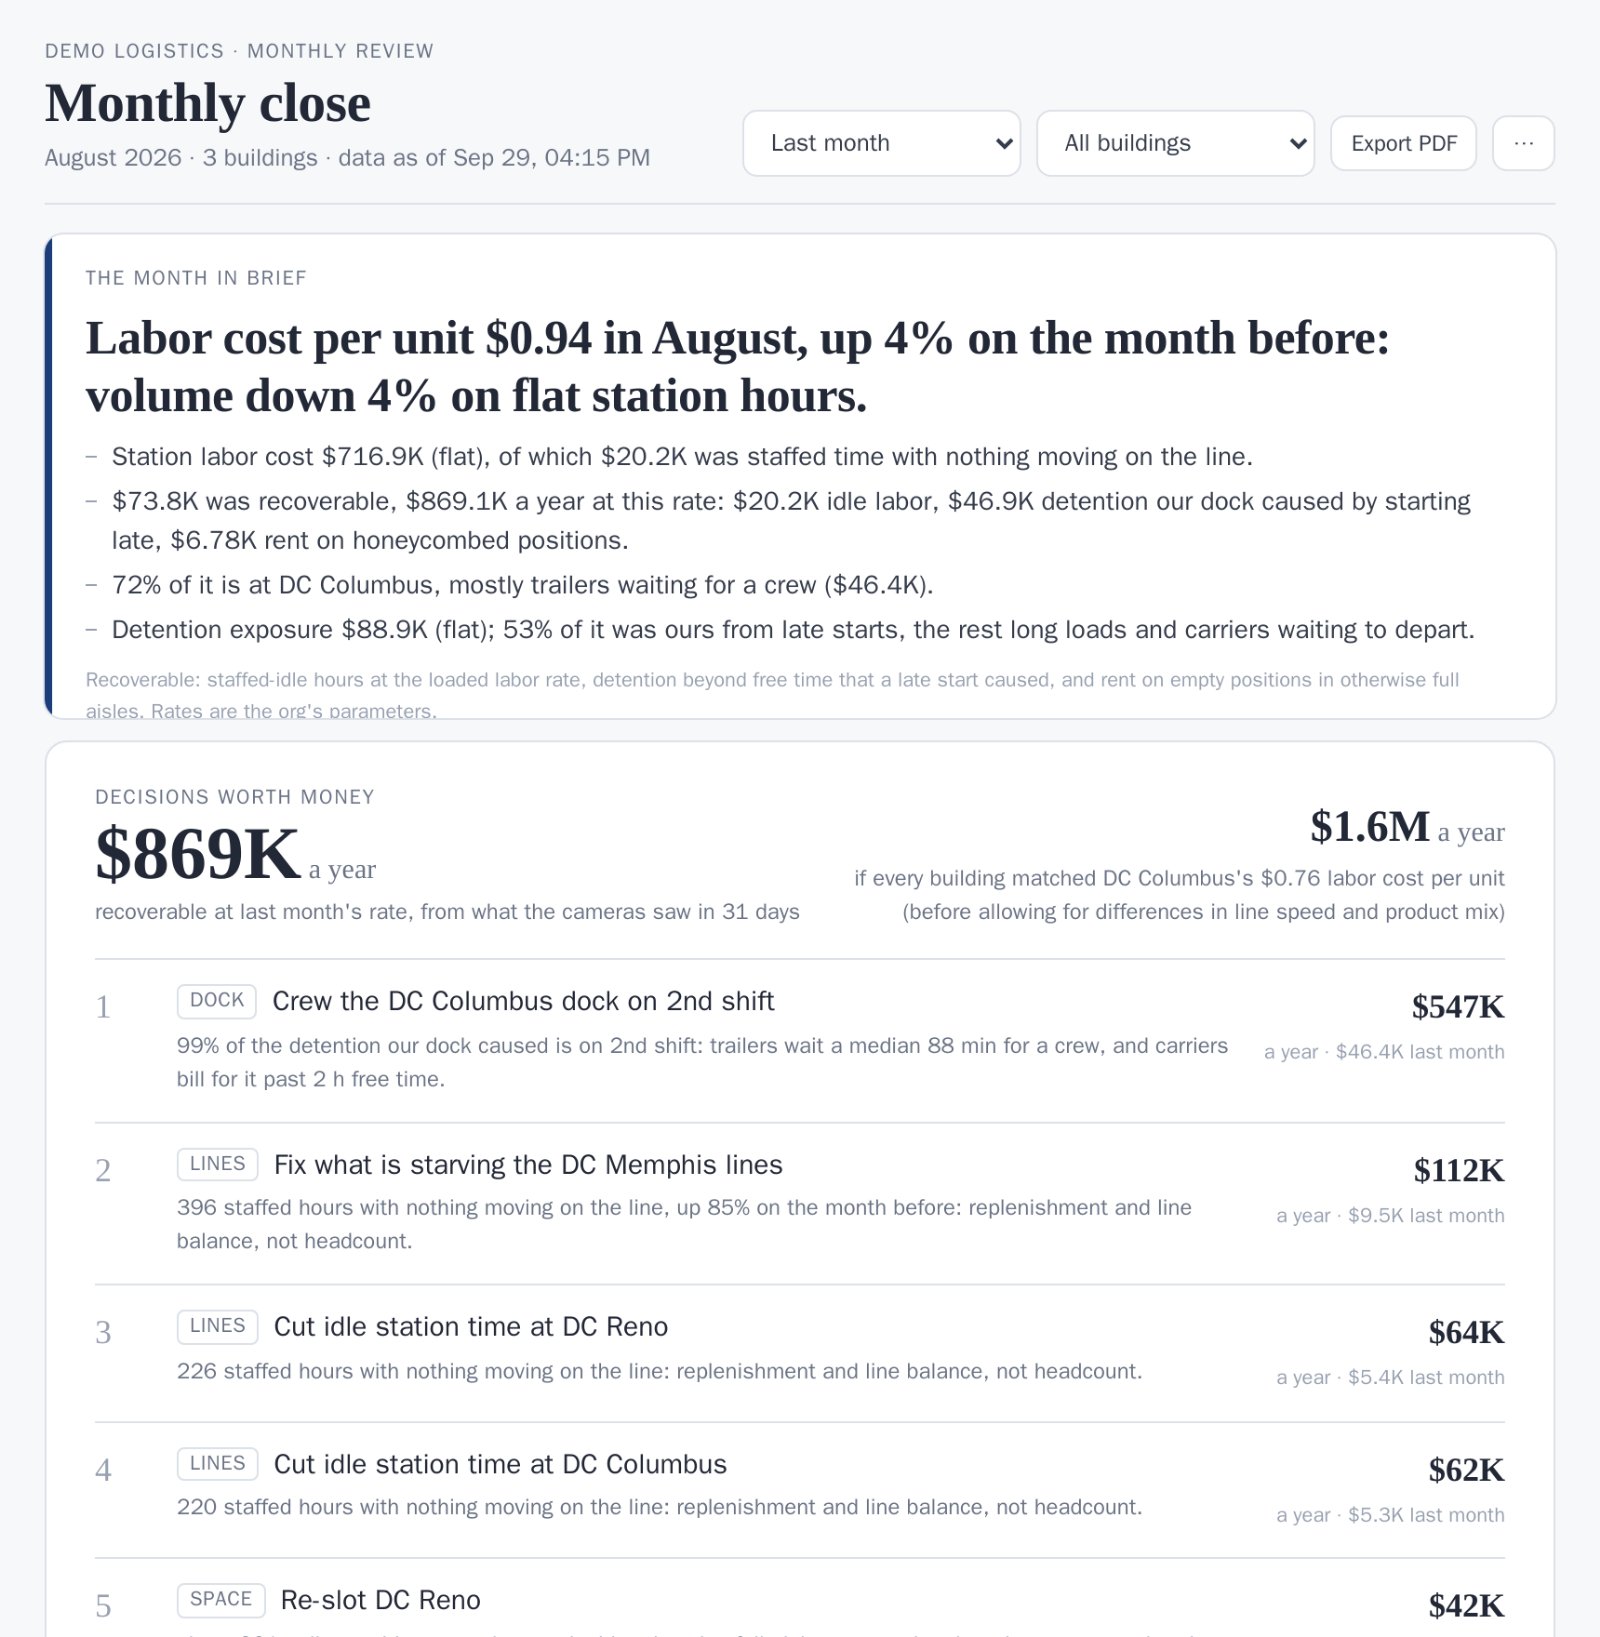
Which sites leak money, why, and what fixing it is worth.
Weekly, monthly and quarterly packs in dollars, site against site. Each opens with a brief written from the numbers and ranks the decisions worth making.
- Recoverable dollars by site and by cause
- What moved cost per unit, step by step
- Drill from any row to the site behind it
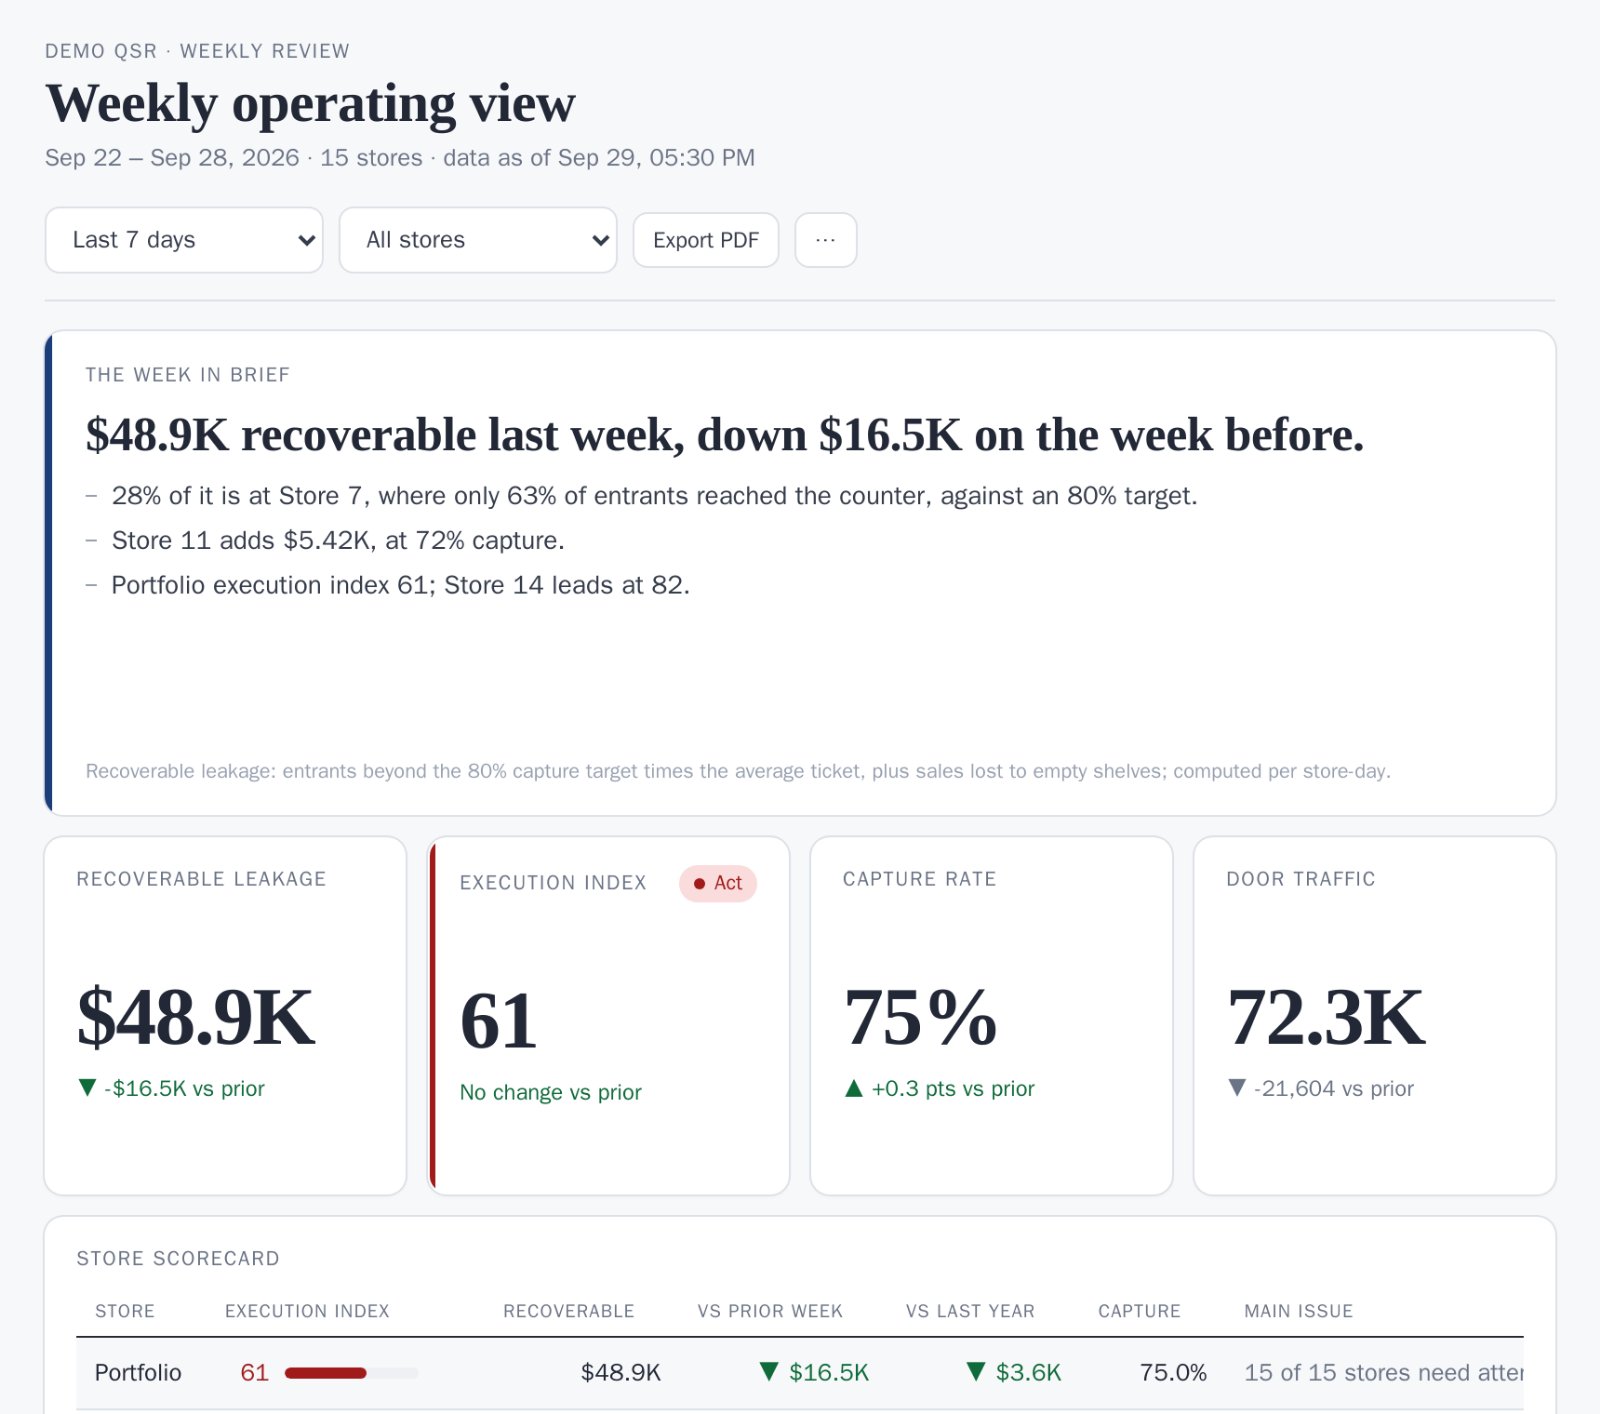
What needs fixing today, and what ran worse than usual yesterday.
One page per site and day: a list ordered by what it costs, today's numbers against the site's own usual, and the plan for the day.
- A table to clear, a station left empty, a pan to cook
- Line wait, walk-outs and waste against the usual
- A bake plan built from the site's own history
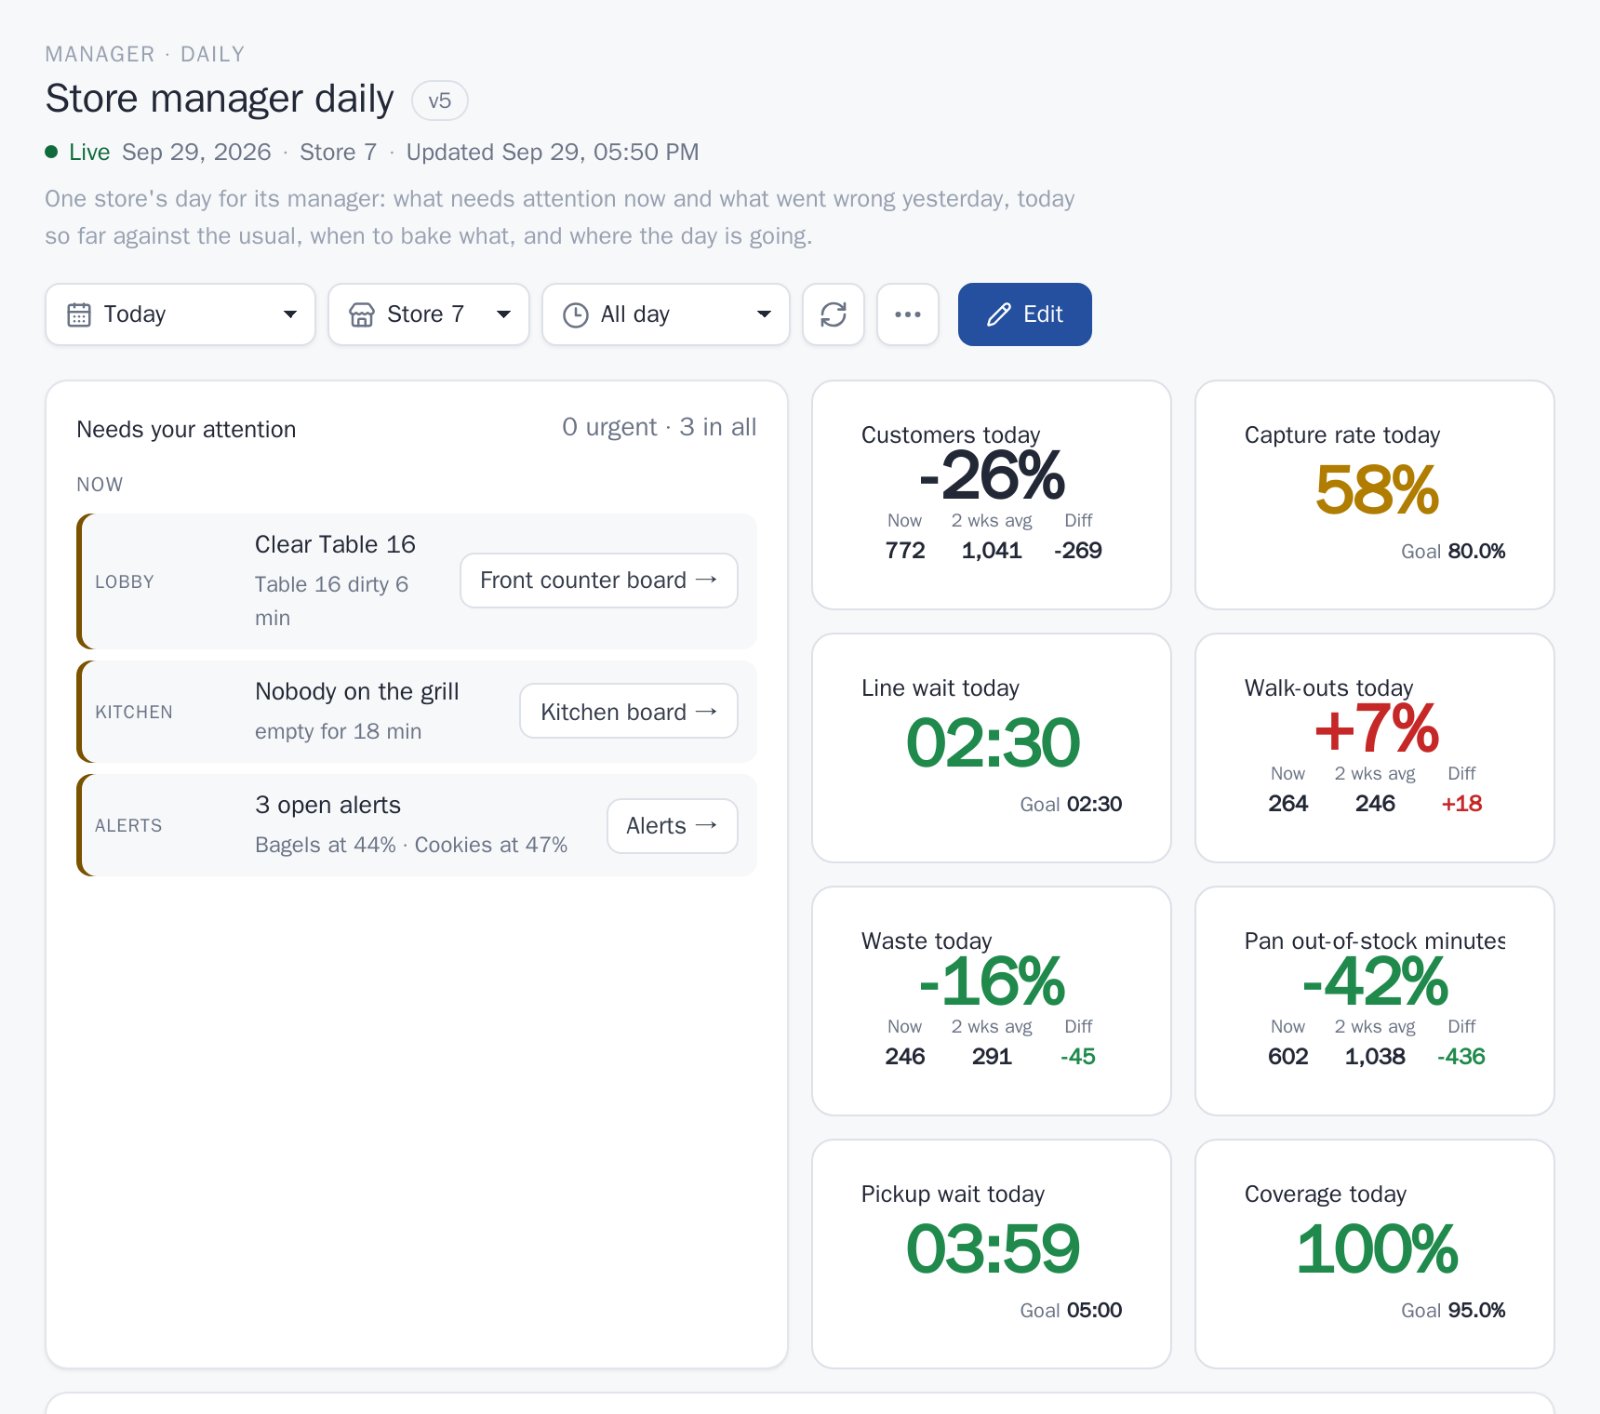
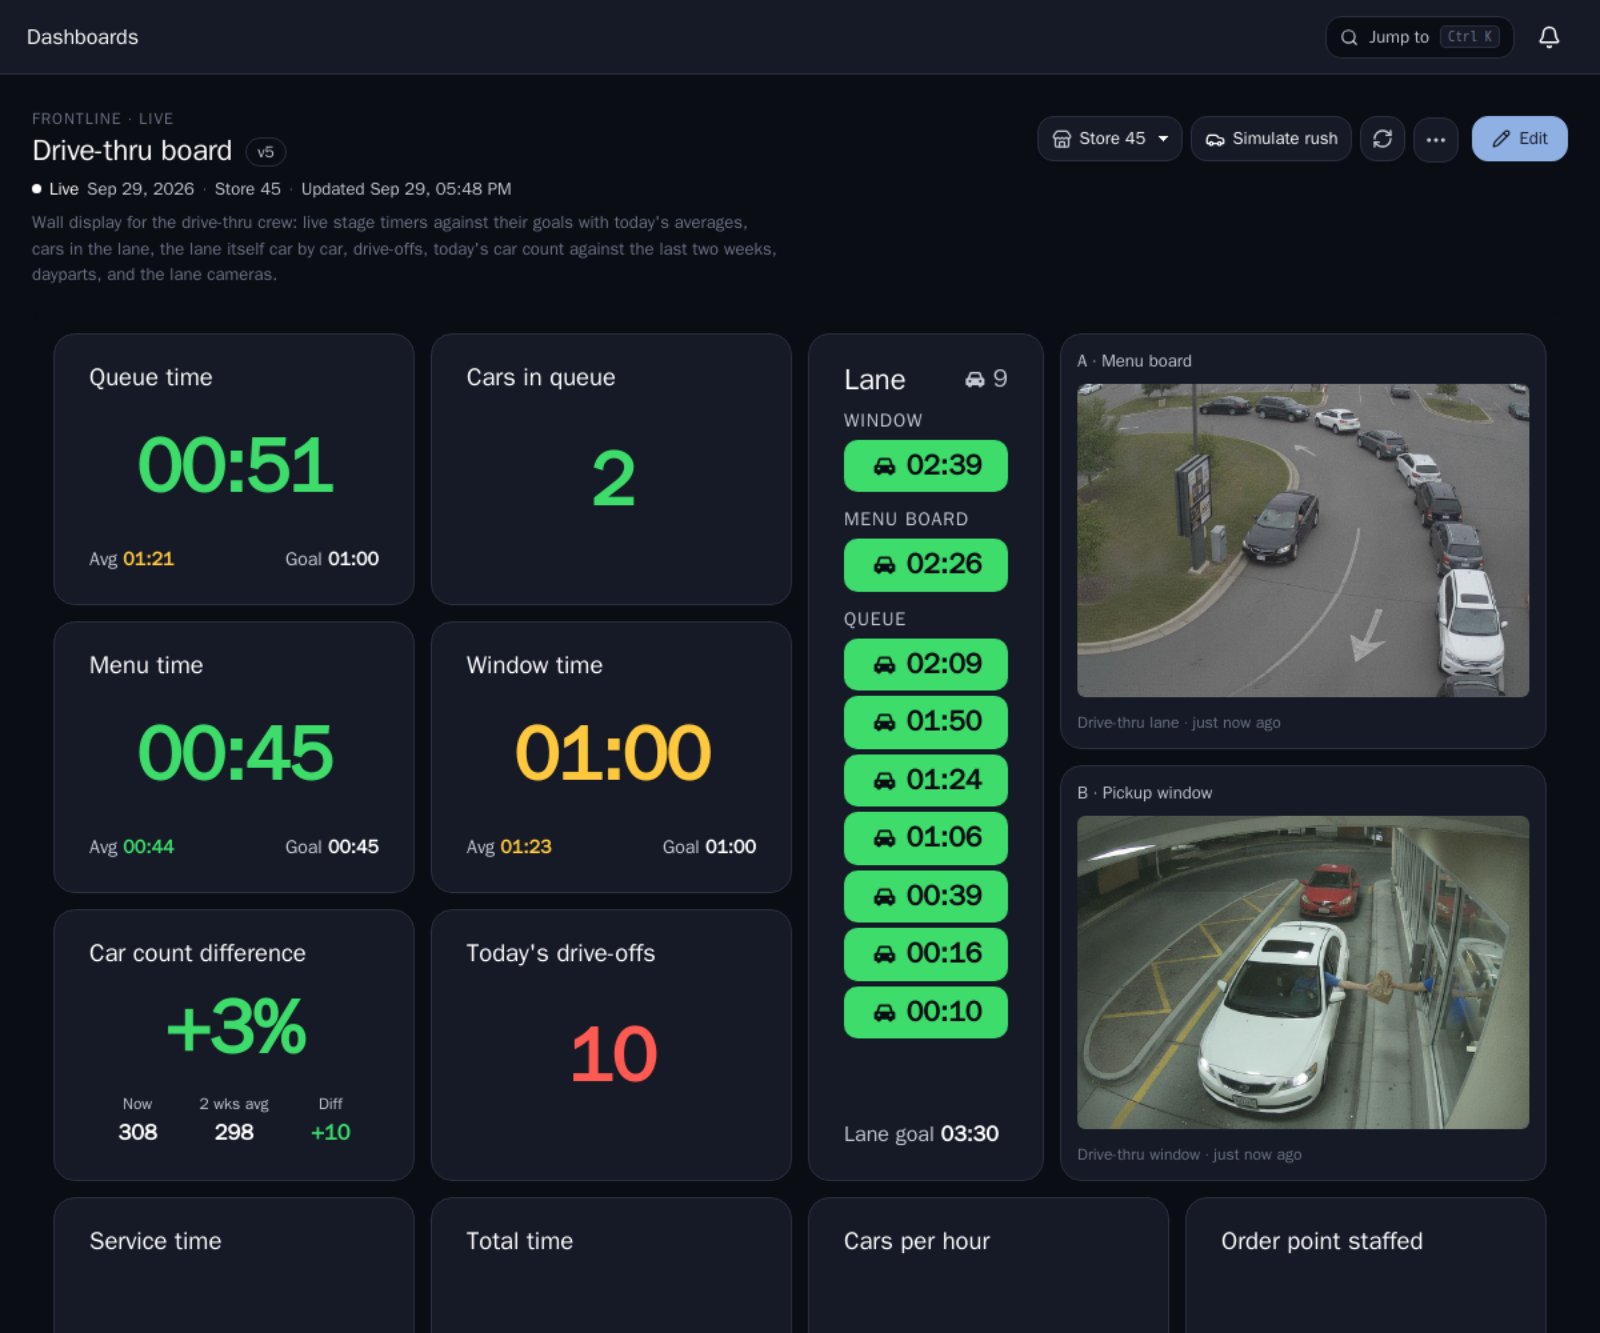
Wall boards that tell the crew what to do next.
Large, glanceable boards for the drive-thru, the kitchen, the dock and the pack line, refreshed every few seconds on a screen in the store or the building.
- Drive-thru stage timers and the lane car by car
- Every pan with its level, hold time and when to cook
- Dock doors waiting for a crew, stations backing up
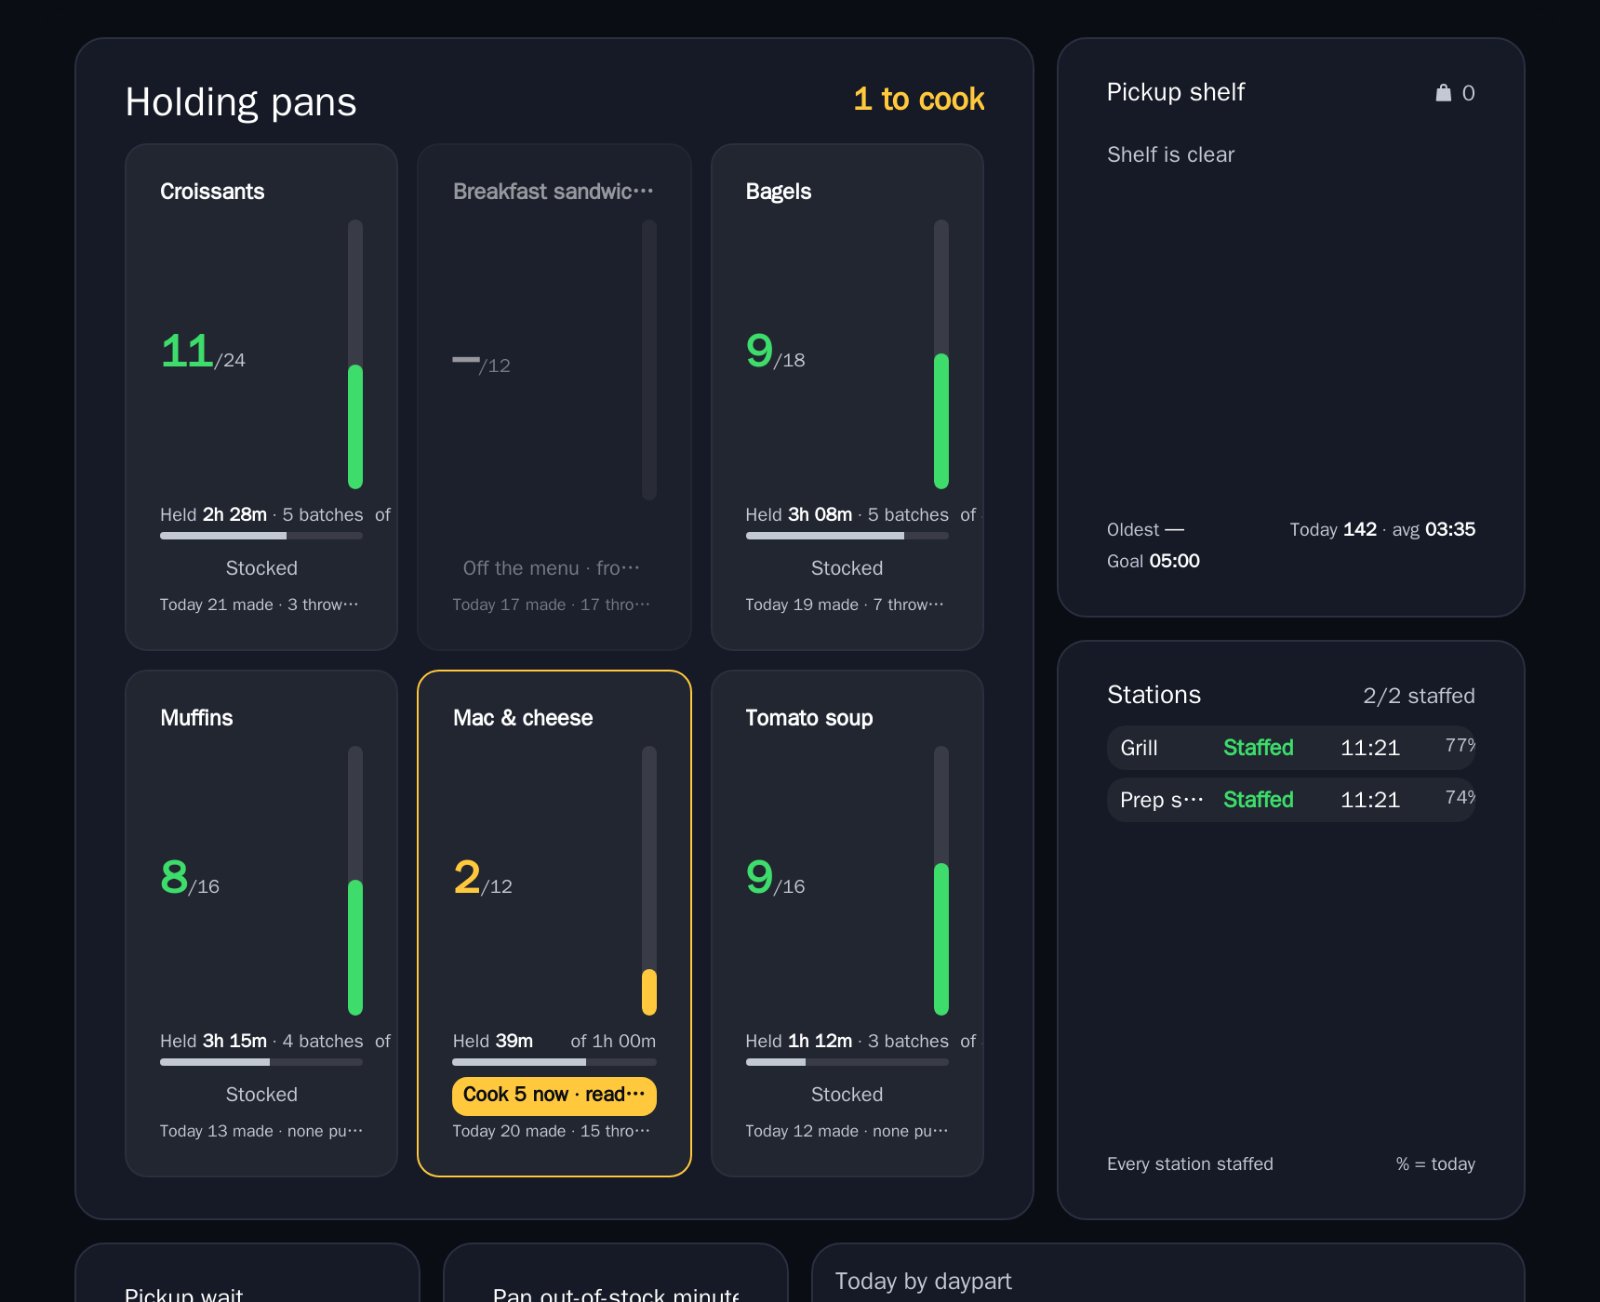
Included with every dashboard.
Templates per industry
Restaurants and warehouses start with a full set of executive, manager and frontline dashboards.
Build your own
Drag in any metric, pick the chart, set goals and thresholds, publish to your team.
Drill down
From the network to a site, a zone, an hour, and the camera still behind it.
Packs as PDF
Export any executive view for the board meeting or the monthly close.
Wall displays
Pair a screen in the store with a code; it shows its board with no login.
Alerts
A line past four, a trailer waiting for a crew, a blocked exit: sent to the right person with the evidence.