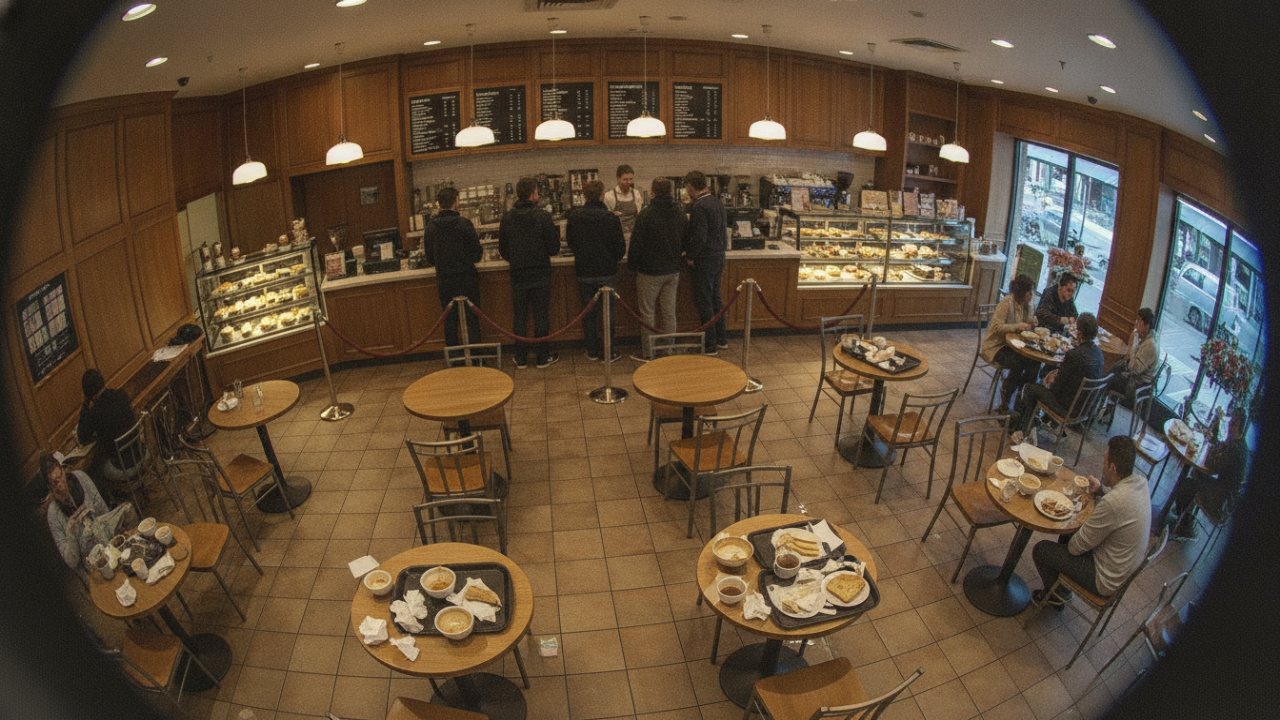
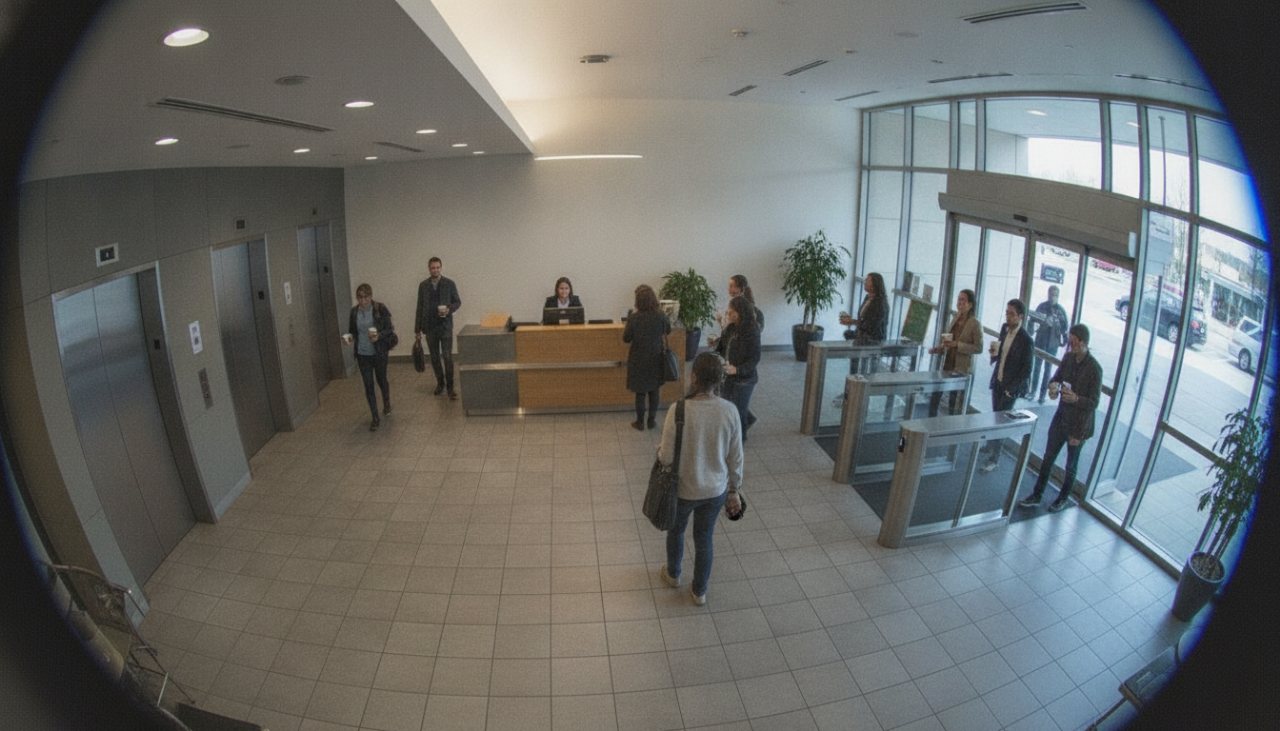
 Lobby · 142 in since 8:00
Lobbies and entrances
People in and out by entrance and hour, peak occupancy
VideoBI counts the people who use your buildings, including the visitors badge data misses: how many come through the lobby and when, which amenity floors earn their space, how full the garage is at 10 am, how long the loading dock is blocked. It turns the cameras you already run for security into the evidence behind leasing, capital and operating decisions across a portfolio.
Leasing, amenity investment and operating budgets depend on how buildings are used, hour by hour. Badge swipes miss visitors, tailgaters and anyone in the garage; surveys are months old, and decisions worth millions are made from them.
Badge counts miss visitors and shared entries, and say nothing about the garage, the plaza or the amenity floor.
The fitness center or conference floor that tenants say they want may sit empty most of the day.
Cleaning, security and loading dock staffing follow a fixed timetable that may not match when the building is busy.
An edge device on site reads the cameras and writes readings for the zones that matter. The video stays in the building.
Lobby · 142 in since 8:00People in and out by entrance and hour, peak occupancy
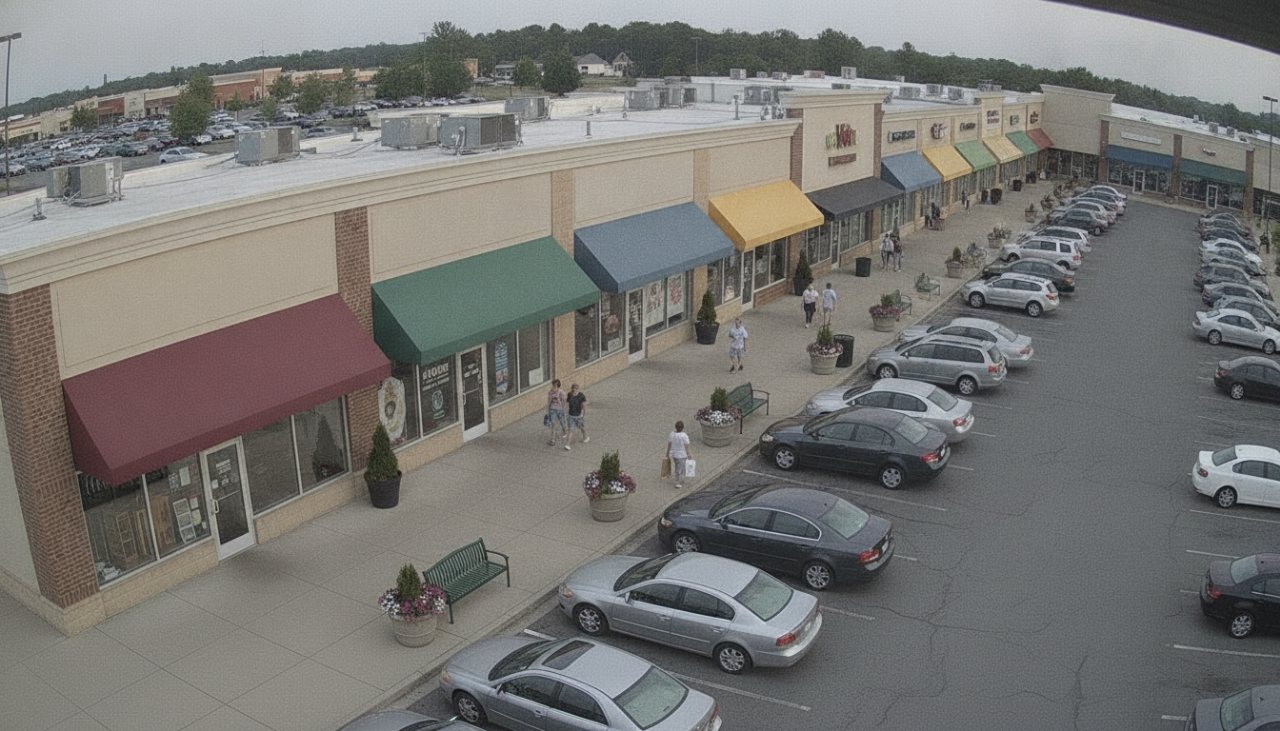
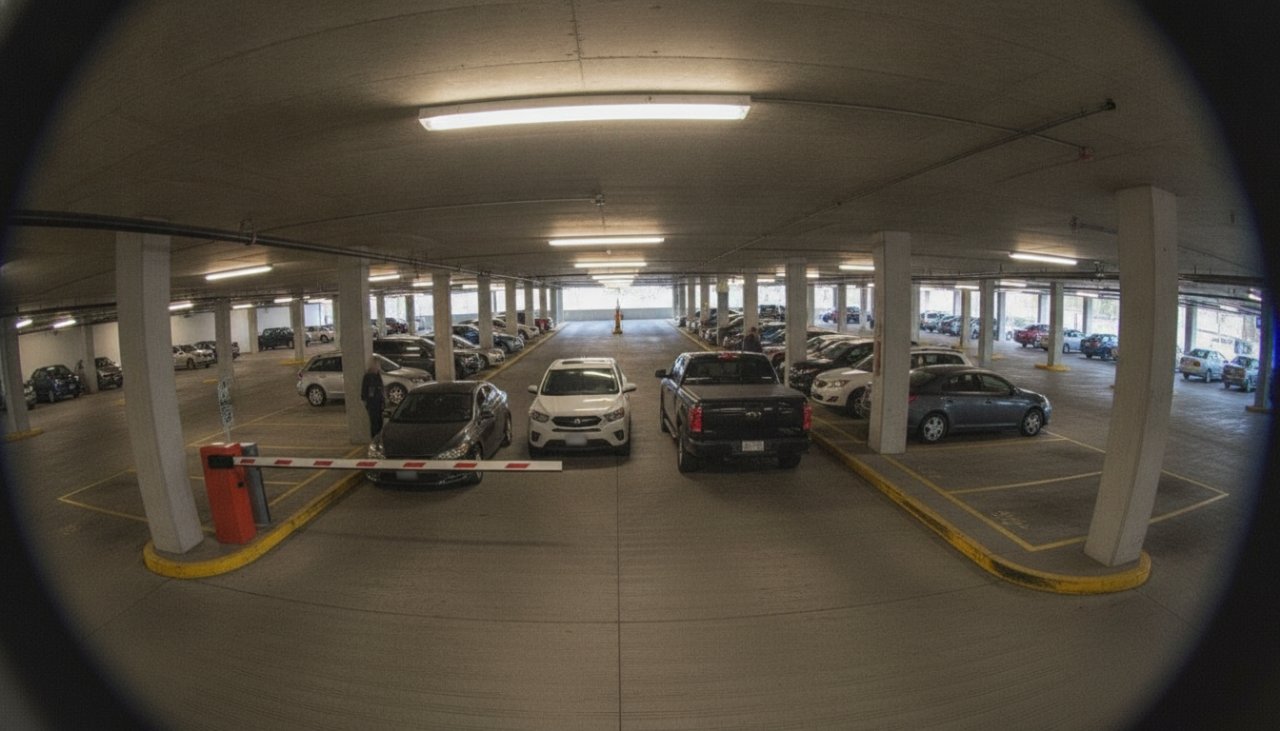 Garage 68% full · 9:40
Stalls occupied by level and hour, entries, turnover
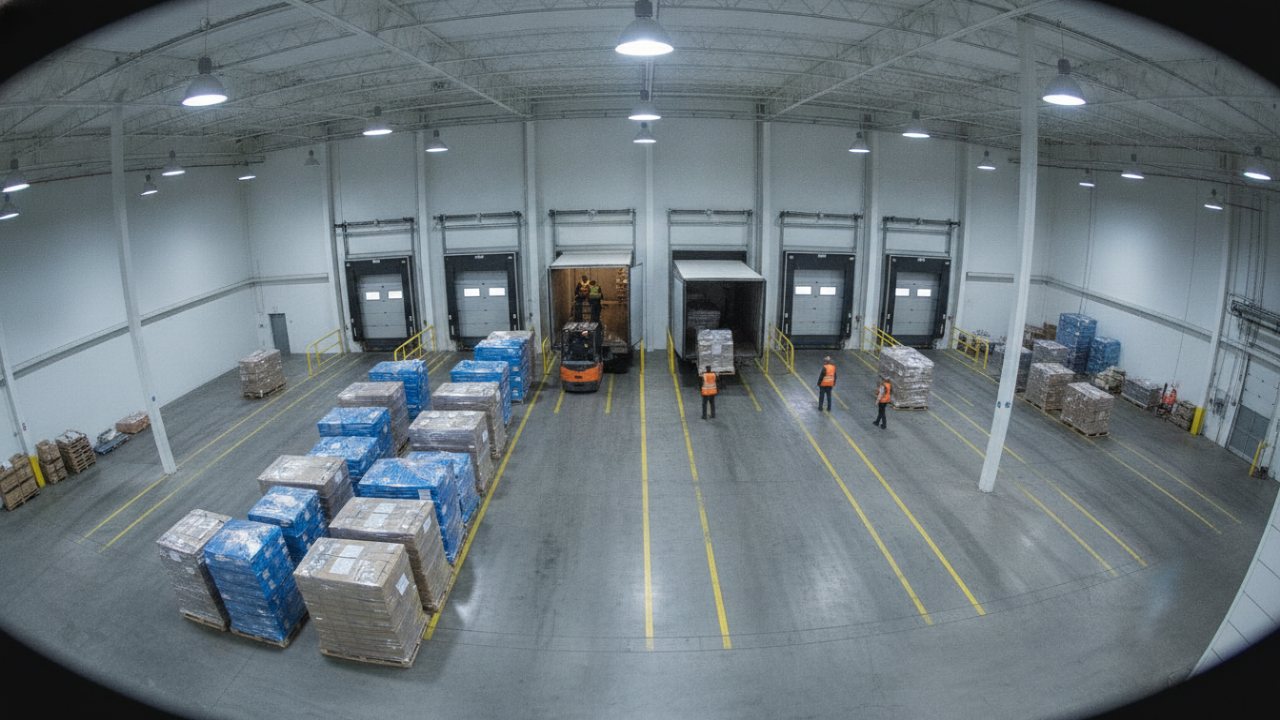
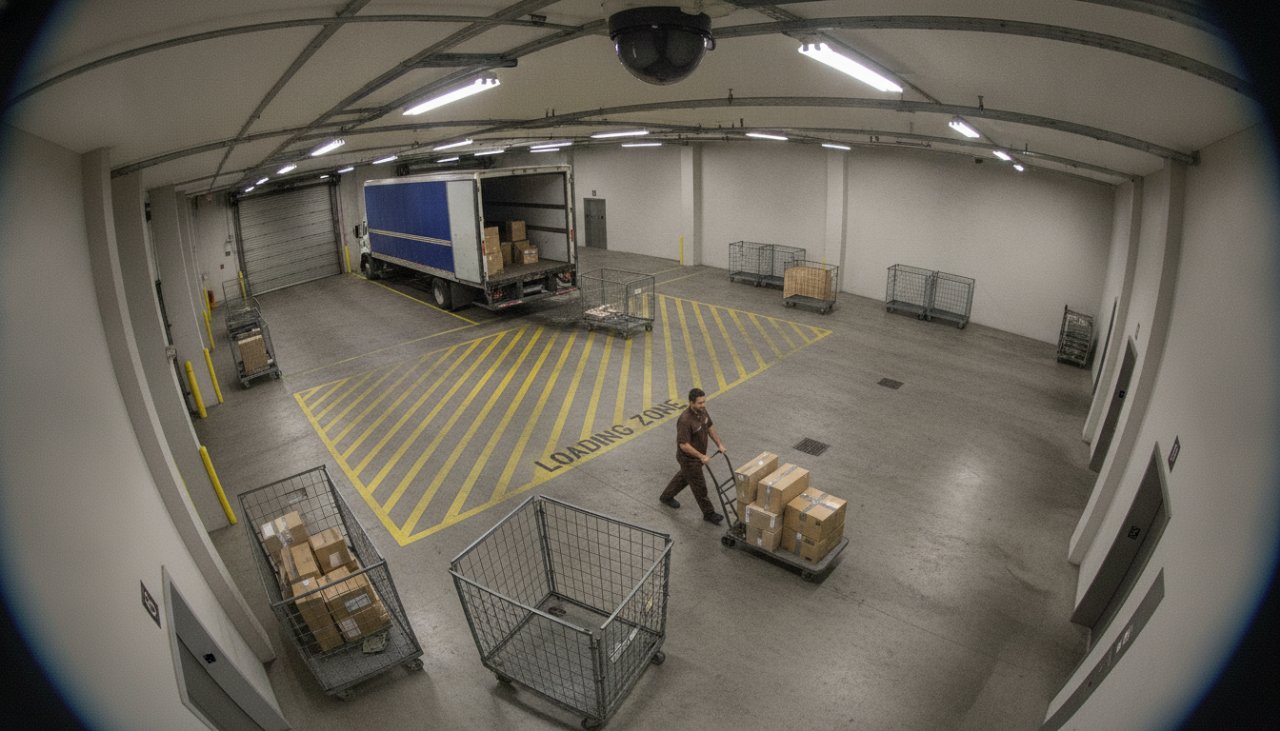 Bay 2 · occupied 34 min
Bays occupied and for how long, deliveries by hour, after-hours activity
Measured occupancy and foot traffic by building, floor and hour support rents and renewals.
Occupancy by level and hour shows where to sell monthly permits, transient parking or event rates.
Use by hour and day shows which amenities earn their space, and which to repurpose.
Portfolio evidence of return-to-office trends, for leasing and marketing.
Staff to measured occupancy by floor and hour.
Bay occupancy and dwell show when a dock master or scheduling pays for itself.
Doors, docks and garages active outside operating hours, with the still to prove it.
Lobby, elevator and garage upgrades sized from measured peaks.
Each role sees the same governed numbers, arranged for the decisions it makes.
Portfolio occupancy, Tuesday to Thursday peak
Building A leads, Building C trails its submarket
Garage level 3 unused before 11 am, all quarter
Lobby peak moved from 8:45 to 9:30
Dock bay 2 blocked 3 hours on Wednesday
Two after-hours entries at the service door
Loading zone B: blocked 25 min
Garage level 1 full · level 3 has space
Lobby turnstiles: queue building
Ask VideoBI in plain language. It investigates across every site and answers with the numbers and the evidence behind them.
Ask answers from your own sites' readings: the measured numbers, the sites and hours behind them, and what the cameras can't see.
Early access: Ask is set up with your first sites. How Ask works →
Recoverable dollars are counted week by week and pay for the system. Decisions about capital, leases and operating models made with the same evidence affect results for years.
Early access: we set up each measure with you, on your buildings and your rates.
We'd like to use analytics cookies to see how people use this site, and LinkedIn's tag to measure our ads. Both stay off unless you accept. Cookie notice