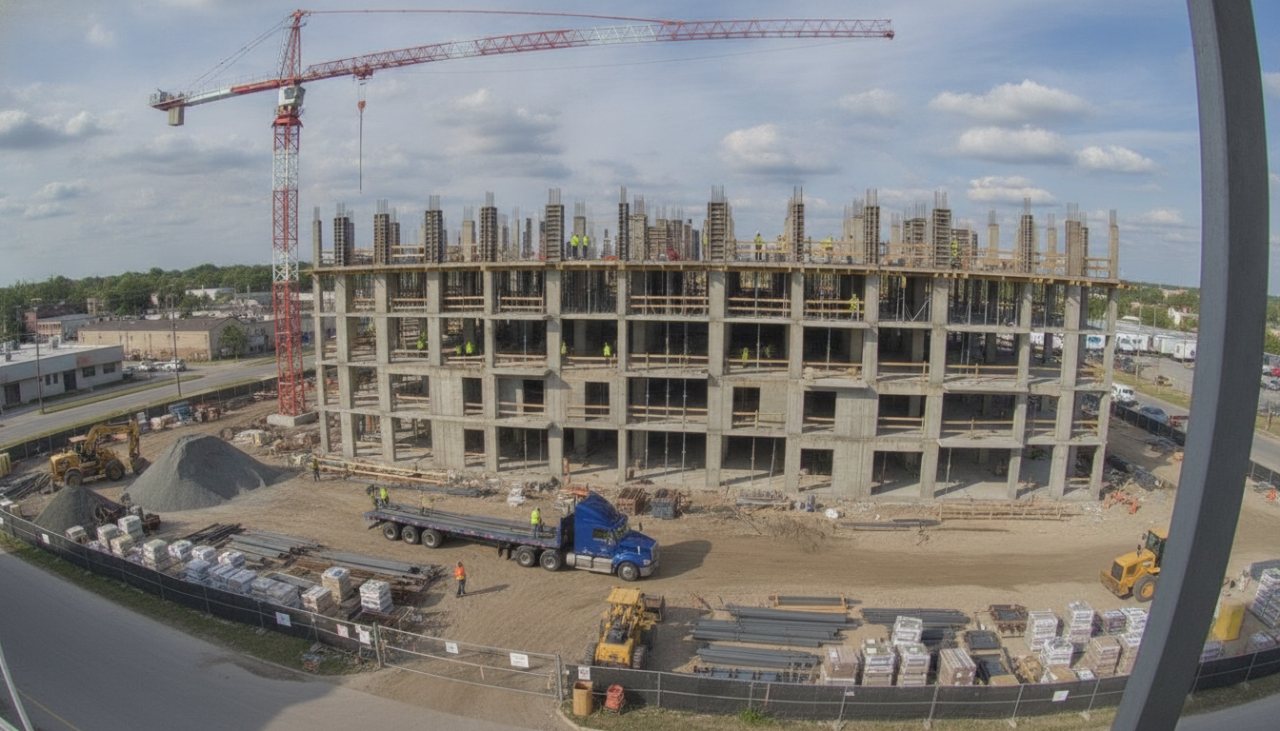
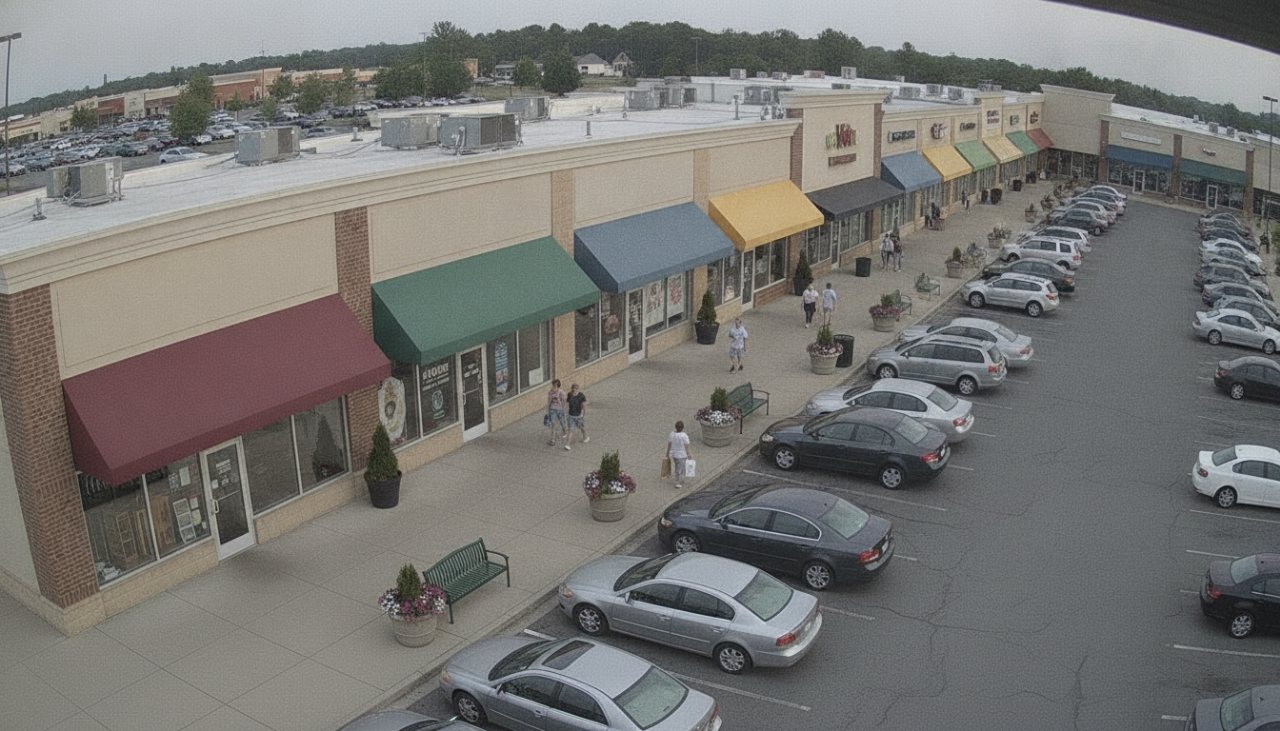
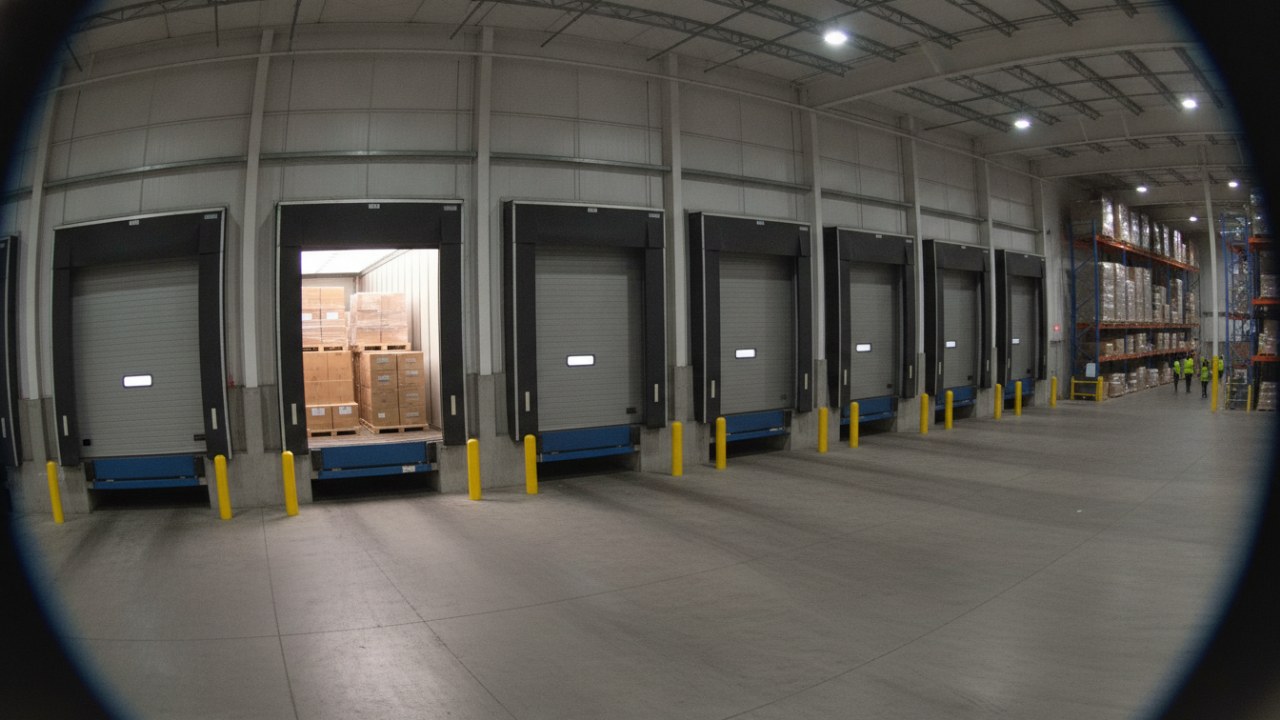
 Door 2 · waiting 48 min
Dock doors
Trailers at each door, arrival to crew start, turn time
A WMS records what shipped. VideoBI measures the work that happened before it shipped, such as the trailer that waited two hours for a crew, the line staffed with nothing moving and the rack full of half-empty positions. It turns each building's cameras into the cost per unit, detention and capacity numbers that finance, the site leader and the floor work from.
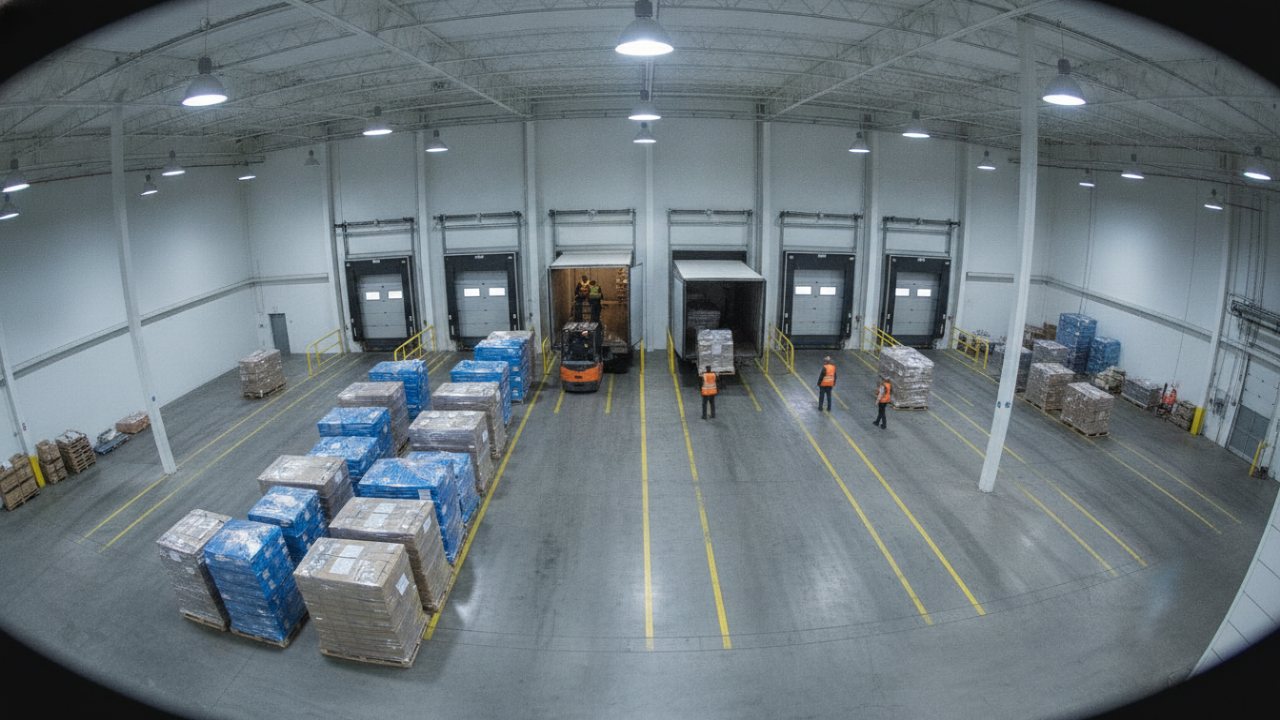
The WMS counts units and orders and the labor system records punches, but neither records the forty minutes a trailer waited at the door before anyone touched it, or the hour a pack line stood staffed with no work arriving. Without that record, the usual response is more headcount or a new building.
Carriers bill for time past free time, and the invoice doesn't show whether their late arrival or your late start caused it.
On the labor report, a staffed station with nothing moving costs the same as a productive one.
Half-empty positions make a building seem out of room well before it is.
An edge device on site reads the cameras and writes readings for the zones that matter. The video stays in the building.
Door 2 · waiting 48 minTrailers at each door, arrival to crew start, turn time
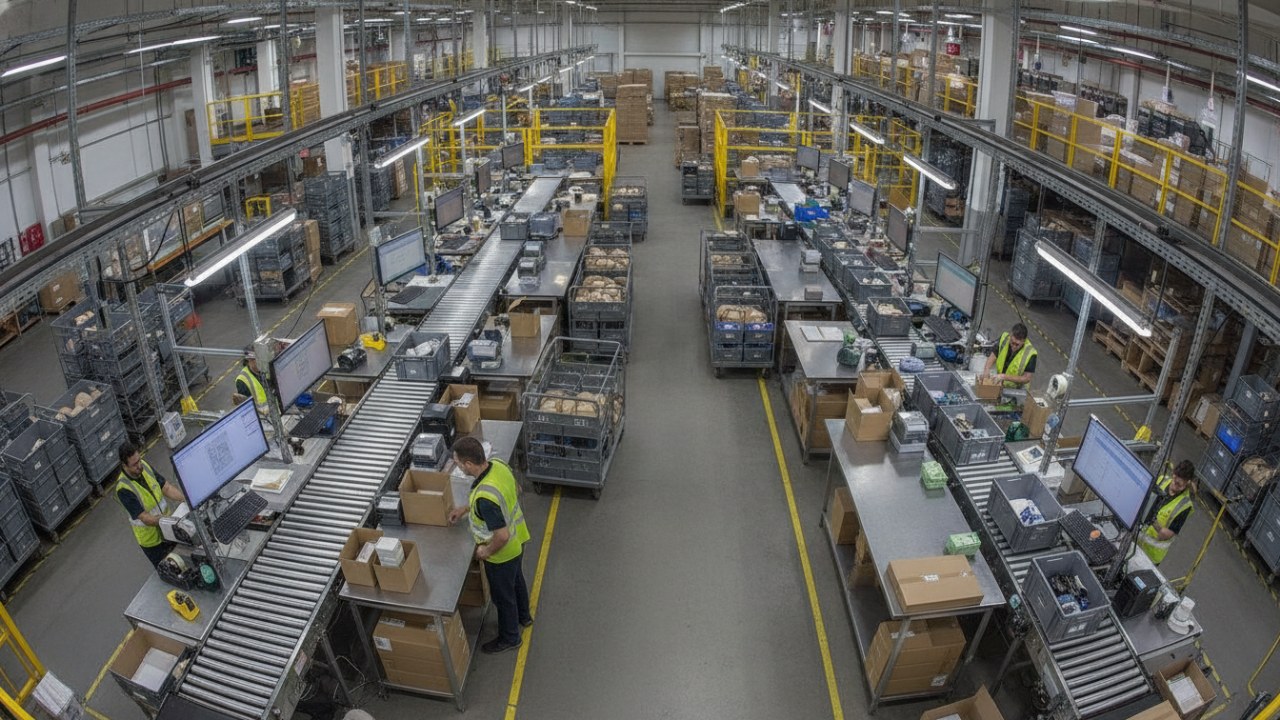 Line 1 · no totes 14 min
Stations staffed, units moving, staffed time with nothing moving
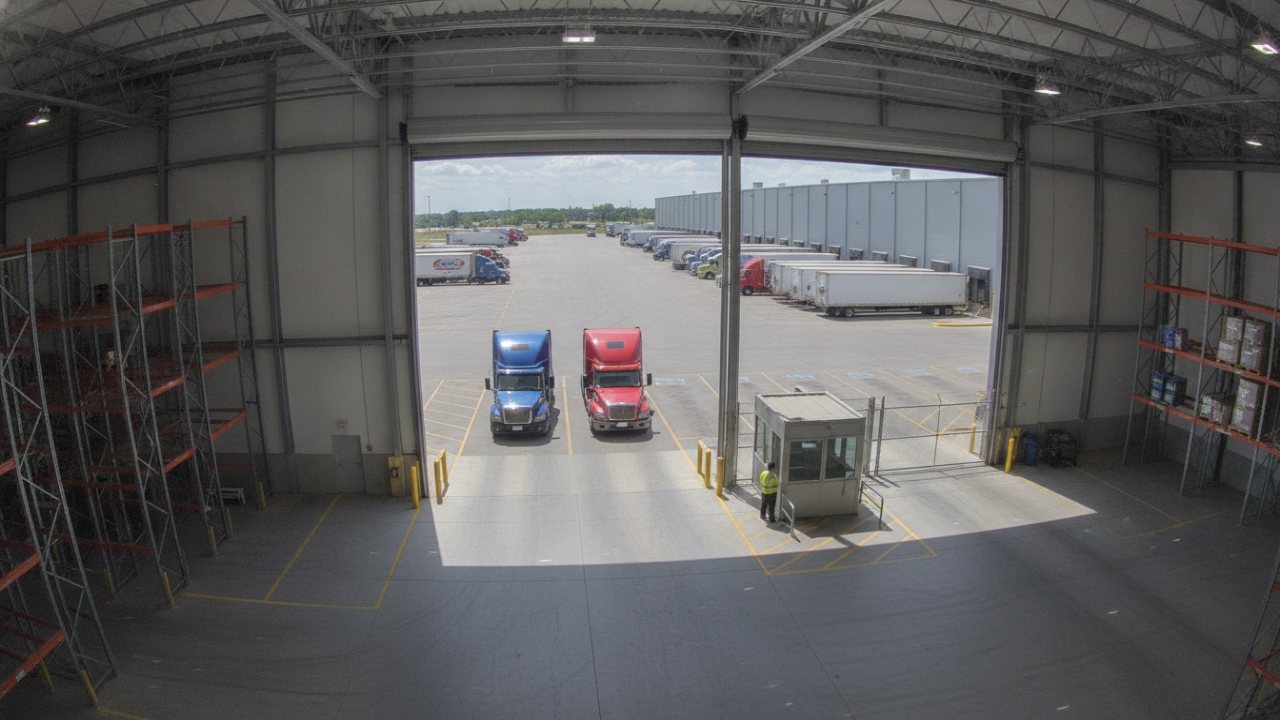 Yard 84% full
Trucks arriving and leaving, yard fill, gate to door time
Arrival-to-crew and crew-to-release times per door show where dock capacity really goes.
SLA evidence per trailer and per order, with the timestamps to back it.
Measured slot occupancy and honeycombing show how much room the building really has.
Replenishment gaps show up as staffed time with nothing moving, by line and hour.
Separate your late starts from carriers' late arrivals, trailer by trailer.
Staffed time with nothing moving, priced at your loaded labor rate.
See what moved cost per unit, step by step, and which building sets the standard.
Rent on half-empty positions in otherwise full aisles.
Each role sees the same governed numbers, arranged for the decisions it makes.
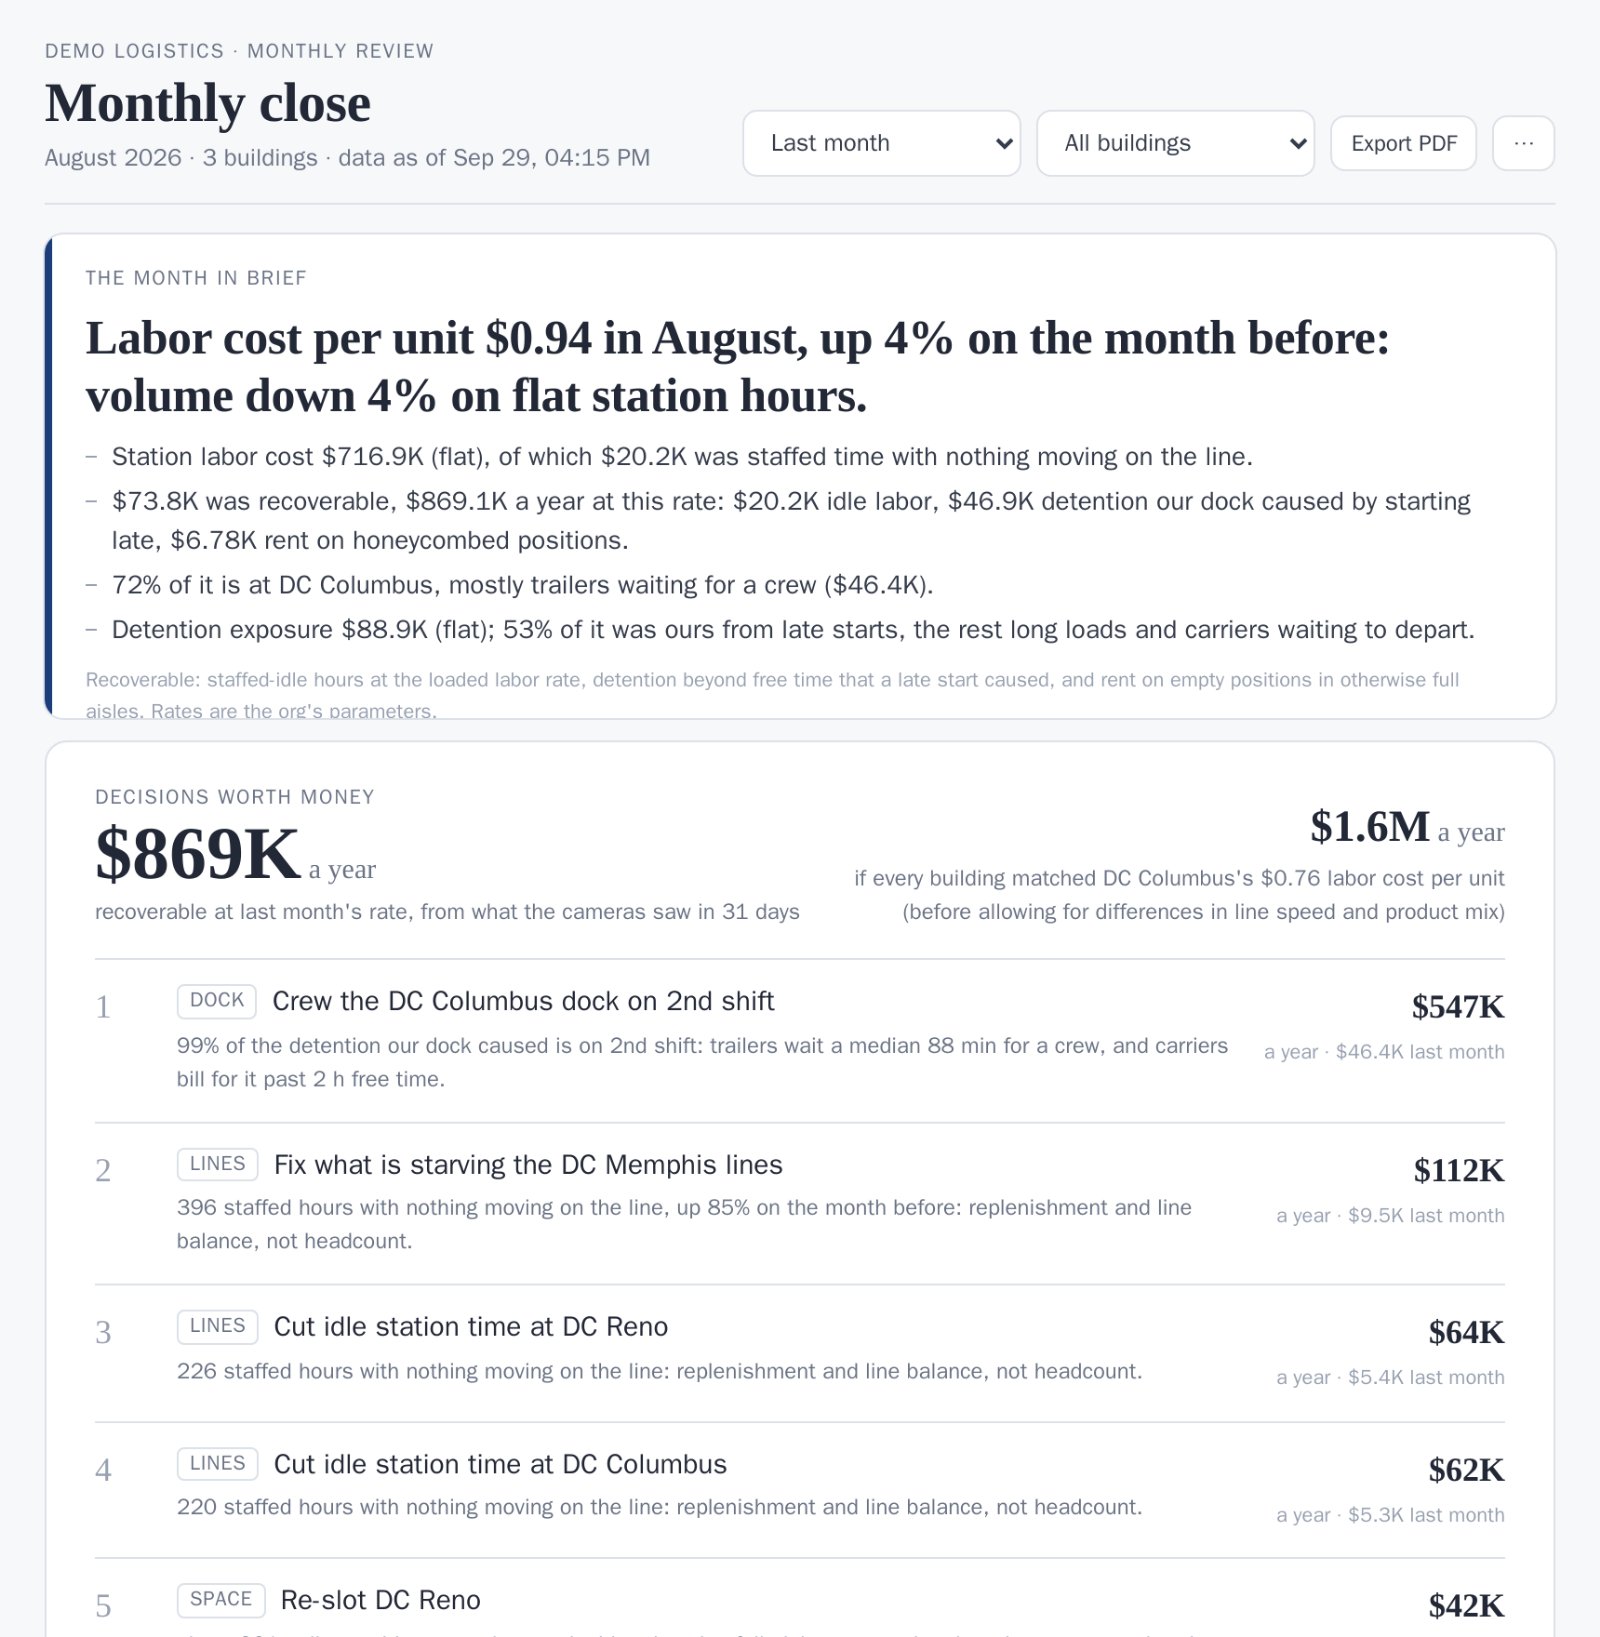
Ask VideoBI in plain language. It investigates across every site and answers with the numbers and the evidence behind them.
Mostly ours: trailers wait for a crew at our doors, not for carriers in the yard. DC Columbus carried $218K of detention last quarter, with 3,868 trailers over free time. Starting every trailer within the 0.5 h target would have avoided $134K, $538K a year. The yard wait is short: a median 0.2 h.
A real answer from Ask in the live demo's sample network. How Ask works →
Recoverable dollars are counted week by week and pay for the system. Decisions about capital, leases and operating models made with the same evidence affect results for years.
Recoverable dollars use the network's own rates: loaded labor rate, detention rate and rent per position.
We'd like to use analytics cookies to see how people use this site, and LinkedIn's tag to measure our ads. Both stay off unless you accept. Cookie notice