De‑risk new restaurant openings with data
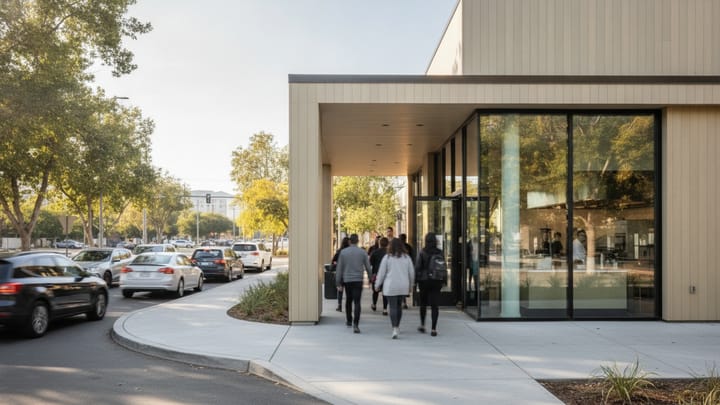
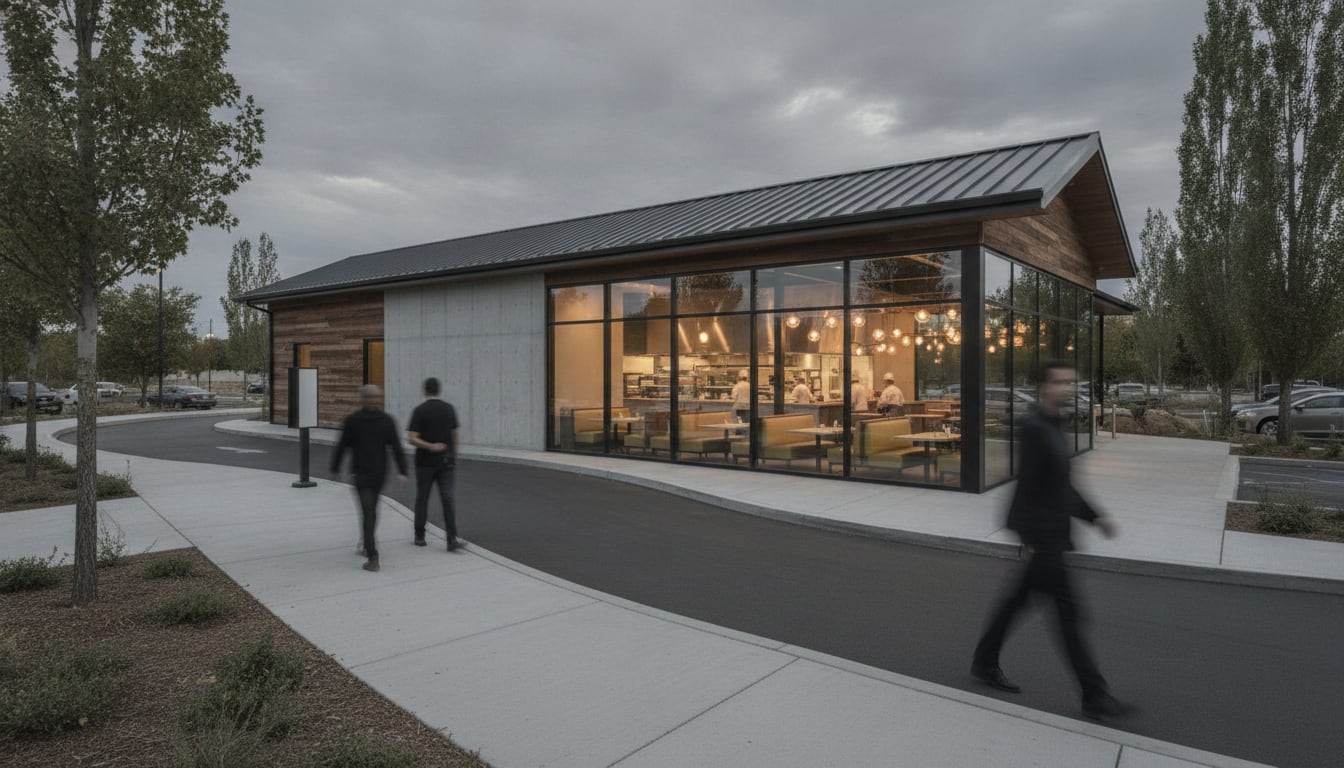
Opening a new restaurant brings many unknowns: how many cars will line up at the drive‑thru, how many walk‑ins to expect, what staffing levels are needed for each hour, and how much inventory to prepare. The first way to reduce those unknowns is to replace assumptions with measurements. VideoBI’s on‑site device, the Scout, connects to the cameras a chain already has, processes video locally, and outputs anonymized counts and timestamps. Those readings feed into the VideoBI dashboards that executives, managers, and frontline crews use to make real‑time decisions. By treating the camera system as a sensor network, a chain can build a data set that guides every stage of a new‑store launch.
Leverage the cameras you already own
Most casual‑dining locations already have security cameras covering the drive‑thru lane, the front entrance, and the kitchen. Those cameras capture the same visual information that a dedicated traffic sensor would, plus additional cues such as pedestrian flow and door‑open events. The Scout attaches to each camera feed, runs the video on the edge device, and extracts counts without sending raw video offsite. The result is a steady stream of numeric readings—vehicles per minute, pedestrians per interval, door‑open events—that can be displayed on the dashboards and queried through the natural‑language "Ask" interface.
Gather baseline traffic before the first customer arrives
Collecting baseline data in the weeks leading up to a grand opening helps create a realistic picture of local demand. Two simple measurements are especially useful:
- Drive‑thru traffic at nearby competitors – Position a temporary sensor or use a borrowed camera view of a competitor’s drive‑thru during a typical lunch hour. The Scout will count vehicles every 15 minutes, producing a reference point for expected volume.
- Sidewalk pedestrian flow – Capture a short video of the sidewalk in front of the future location. The edge device can count pedestrians per 15‑minute interval. Pedestrian counts are valuable for estimating walk‑in demand.
Combine the two streams to identify the busiest hour blocks for both drive‑thru and walk‑in traffic. For example, if a competitor’s count shows 30 cars per hour between 12:00 pm and 1:00 pm and the sidewalk count shows 120 pedestrians in the same period, you have a baseline that can be adjusted for your brand’s draw factor.
Translate counts into staffing plans
With an estimated vehicle count per hour, calculate the number of staff members needed to meet a target service time. A simple formula is:
Required staff per hour = (Cars per hour) ÷ (60 minutes ÷ Target service minutes per car)
If the target service time is 2 minutes per car and the forecast for the lunch hour is 45 cars, the calculation yields 1.5 staff members dedicated to the drive‑thru lane. Round up to ensure coverage, then add kitchen and front‑of‑house staff using the same approach for each service step. The staffing plan can be entered into the scheduling system and monitored on the dashboard.
Align inventory with traffic forecasts
Traffic forecasts also drive inventory decisions. Multiply the expected number of guests by the average ticket size for each menu category. For instance, if the forecast predicts 150 guests on opening day and the average breakfast ticket is $9, the projected revenue is $1,350. Use that figure to create a preliminary order list for ingredients, then adjust for perishable items that have short shelf lives. Matching inventory to measured demand reduces waste and avoids stock‑outs.
Real‑time monitoring on opening day
During the first week, the VideoBI dashboard shows three core panels that keep the operation aligned with the forecast:
- Cars per hour – A line graph updated every 30 seconds compares actual traffic to the pre‑opening estimate.
- Average service time – A gauge displays the current service time for each car, indicating whether the target is being met.
- Food waste vs forecast – A table flags any menu items where waste exceeds the projected sales volume.
If the car‑per‑hour line spikes above the forecast, managers can add a crew member to the drive‑thru lane. If the waste table shows excess for a particular item, the kitchen can adjust prep levels for the next shift. Because the same data set is visible to executives, managers, and frontline crews, everyone works from the same information.
Post‑opening analysis and model refinement
At the end of the first week, compare the forecasted metrics to the actual readings:
- Forecast vs actual car count – Calculate the deviation and note any systematic over‑ or under‑estimation.
- Planned vs actual labor hours – Identify overtime patterns and refine the staffing formula.
- Food waste vs forecasted sales – Adjust inventory orders for the next location based on observed waste.
Documenting these gaps creates a repeatable playbook. The next time a site is opened, the team can import the data set from the first location, adjust for local market differences (for example, a higher car count in a downtown area), and apply the refined staffing and inventory models. This reduces the learning curve and speeds the path to profitability.
Scaling insights across multiple openings
When a chain opens several locations in a short period, the data from each site can be aggregated into the VideoBI datasets. The aggregated data reveal patterns such as typical peak hour ranges for different market types, average service times for specific menu items, and waste ratios for perishable ingredients. Those patterns become the basis for a predictive model that can be applied to future sites before any cameras are installed. The model can be tested against the baseline traffic collected during the pre‑opening phase, allowing the team to validate assumptions early.
Integrating the solution into the launch workflow
The practical steps for incorporating VideoBI into a new‑store rollout are:
- Audit existing cameras – Identify which cameras cover the drive‑thru, entrance, and kitchen.
- Deploy the Scout – Connect the Scout to each camera using the instructions on the edge device page.
- Configure data collection – Set the device to output vehicle counts, door‑open events, and pedestrian counts.
- Create forecast models – Use the baseline traffic data to build staffing and inventory spreadsheets.
- Monitor on opening day – Track the three core dashboard panels and adjust operations in real time.
- Analyze post‑opening – Compare forecasts to actuals, update the model, and store the results for future use.
Following this workflow turns a high‑risk launch into a data‑guided process. The approach works for any casual chain, whether the menu is ramen, burgers, Greek, breakfast, poke bowls, or bubble tea. By relying on counts rather than assumptions, the chain can make informed decisions about labor, inventory, and customer experience from day one.
Next steps
If you are planning a new location and want to see how the VideoBI dashboards look in practice, request a demo or contact the sales team. The demonstration will show how real‑time counts appear on the executive, manager, and crew views, and how the "Ask" feature can answer questions such as "What was the average drive‑thru wait time yesterday?" without writing a query.
For more information about how VideoBI works with existing cameras, visit the cameras page. Pricing details are available on the pricing page.